
Statistical Characterization of River Water Physico-Chemical Parameters in a Highly Heterogeneous Land Use Area Along River Kano
Adamu Mustapha, Hamza Isiyaka Ahmad, Suleiman Mukhtar and Nura Isyaku Bello
https://doi.org/10.66845/dstem.2026.00007
Cite this article
Related Articles
Measuring Human Mycotoxins Exposure Using Biomarkers - A Review
Ukpai Eze
Dialogic STEM Journal · 2026
ArticleClimate Change Resilience and Adaptation Pathways for Africa’s Agricultural Sector
Francis Bisong, Asuquo Okon, Ekaba Bisong and Jackson Akor
Dialogic STEM Journal · 2026
ArticleDesign, Prototyping and Testing of Mechatronic Spinner for Domain-Based Systems Thinking
Chukwuma Ogbonnaya and Chagary Ranjan
Dialogic STEM Journal · 2026
ArticleDynamic Differential Games of Nuclear Proliferation and Preemption under Uncertainty
Innocent Adinebo Katule and Akindele Michael Okedoye
Dialogic STEM Journal · 2026
Contents
Abstract
River Kano is prone to water pollution due to its proximity to many pollution sources like domestic wastewater, industrial effluent discharge, solid waste disposal and agricultural runoff. Surface water samples were collected at the upper, middle and lower profile of Kano River during wet and dry season of 2012 with a view of evaluating the spatial variations of the water quality to investigate the sources apportionment of river water quality and to identify the emerging contaminants. Water quality samples were transported to the laboratory in samples bottle pre-washed with HNO3. All samples were stored in ice bottle, preserved at 4º C and subsequently analyzed using laboratory standard methods. Discriminant analysis revealed data reduction and pattern recognition by revealing only five parameters with (p<0.05) affording 91.67% and 93.06% correct assignation for stepwise forward and backward modes of discriminant analysis respectively. Factor analysis revealed that most of the variations of surface water at Kano River profile are explained by salinity, conductivity, pH, TDS, and temperature with 31.6% variability. Multiple linear regression models identified the contribution of each variable with significant values of r = 0.894, R2 = 0.800, (p< 0.05) which strongly suggest that salinity, conductivity, pH, TDS, and temperature are the primary controllers of water quality variation in Kano River Basin.
Keywords
Full text
Reading view1. Introduction
The spatial concentration of river water quality variations are linked with the diverse input of anthropogenic and natural influences [1]. Urban rivers especially in developing countries are prone to water pollution due to its proximity to many pollution sources like domestic wastewater, industrial effluent discharge, solid waste disposal and agricultural runoff. River water received large quantities of hazardous substances which mainly derived from anthropogenic source such as industrial and agricultural activities, domestic and municipal sewage treatment plants as well as runoff and atmospheric deposition [2]. The discharge of excessive nutrients from anthropogenic sources contributes to the enrichment of organic, inorganic and biological parameters in river water [3]. Natural influences such as regional geochemistry, dissolution, precipitation of minerals, water velocity, quantity of receiving water and interactions between different types of water may have a great impact on the surface water quality [4].
Surface water in rivers is the most vulnerable water bodies to contamination due to their easy accessibility for domestic, industrial and agricultural discharges. The constant discharge of contaminants and wastewater into surface water from both anthropogenic and natural influences has a strong effect on the river water quality [5] and such contaminants were found to enhance the concentration of physicochemical parameters and causing great changes in the river water quality and became enriched with various pollutants [6]. The evaluation of river water quality in most developing countries has became a critical issues in recent years and has now reached a point of crisis due to unplanned and fast urbanization, rapid growth of industrializations, significant land use changes and continuous population increase are among the major problems and stresses of the river water quality and have been receiving global attention and interest [7]. Many regions in the world are simultaneously impacted by urbanization processes, industrial and agricultural activities and many cities in urban areas have been developed without adequate and proper planning, this has led to indiscriminate actions including dumping of wastes in to the water, washing, and bathing in open surface water bodies. In such areas, the environmental compartments are affected by pollutants originating from different potential sources. The deteriorating water quality affects man, animal, and plant life with far reaching consequences. From environmental, economical and or social point of view, it is important to identify these sources and their contribution to the total contamination of the area.
In recent years, more attention has been paid to surface water quality, because water quality strongly influences the multi-usage components of surface water [8] and many studies have shown that surface water quality in a given region is determined by both natural (weathering processes, erosion, and run-off) and anthropogenic influences (domestic waste, agricultural waste water and industrial effluent) [9-13]. To find underlying pattern of water quality parameters, the used of statiscal analysis such as discriminant analysis (DA), principal component analysis (PCA), analysis of variance (ANOVA), and multiple linear regressions models (MLR) were used [5]. Moreover the altenative methods that could have been used to identify the spatial variation of surface water quality are geographically weighted regression, time series analysis and machine learning techniques.The aim of this study is to identify the influence of physicochemical parameters on surface water quality variations at the Kano River for effective river water management. The novelty of this study is the used of advanced statistical analysis to investigate the sources apportionment of river water quality and to identify the emerging contaminants.
2. Research Methodology
2.1 Description of the study area
Kano River is part of the complex system of the Kamodugu – Yobe Basin consisting of Hadejia River Basin in which three principal tributaries of Kano, Challawa and Watari streams joined above Wudil to form what is referred to as the Hadejia sub watershed of Lake Chad (Fig. 1). The streams are seasonal and have flash flows with flow rising and falling in response to rainfall occurrences. The high flash flows exceeding 10% of the times are recorded mainly in July and August in response to rainfall events of 30 mm or more. Such heavy rainfall storms are capable of generating high flash flows even at the beginning of the hydrological year; this is attributed to the high intensity of storms. At the beginning of the hydrological year between April and June there is high evaporation and high soil moisture deficiency. There is high concentration of flow between July and September when about 94% of the annual rainfall and 85 to 90% of the stream flow are recorded. The high flows are mainly recorded during this period due to the more frequent occurrences of rainfall storms up to 30 mm. The peak discharge is recorded during this period as well. Stream flow is mainly made up of quick flow component due to higher response of the catchment to rainfall input from the expanded runoff contributing area.
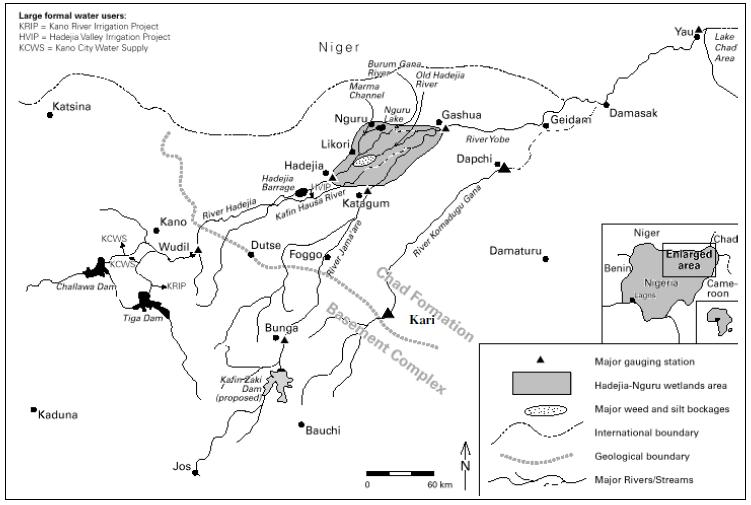
The Upstream of River Kano is underlain by the Basement Complex of Precambrian rocks. The rock types in the area are older granites, and metasedimentary rocks. The older granites are composed of magmatite, biotite gneiss, and banded gneiss. The meta-sedimentary rocks result from the weak metamorphism of sedimentary rock. Wind drift material (a silt wind-blown deposit of the last arid phase) has concealed the pre-arid regolith and its associated ferruginous soils on the upland plain and old alluvial deposits on the river terraces.
The present climate of the study area is the tropical wet-and-dry type which is characterized by a wet season that lasts between 4 and 5 months during which 600 to 900 mm of rain occurs, a third in August alone which marks the peak.Mean annual rainfall recorded at Kano shows that rainfall is highly variable and the rainy season could either start late or end early or both. The rainfall intensity is high with average during the wet season and is believed to be about 30 to 40 mm while intensities of 80 mm or more are common during rainstorms that mark the onset and end of rains.
2.2. Sampling Technique
Grab water samples were collected at the upper, middle and lower course of a Kano River. Samples were collected in triplicates at each sampling point every other day in the early hours of and late evening of the day between March and November, 2012. Fifteen water quality parameters/variables including pH, temperature, salinity, conductivity, total dissolved solids (TDS), total suspended solids (TSS), turbidity, dissolved oxygen (DO), nitrate and nitrites (NO3+NO2), total nitrogen (TN), total phosphate (TP), chlorophyll-a, ammonia nitrogen (TAN), soluble reactive phosphorus (SRP) and Zooplankton density were chosen to represent water quality status in the river profile.
Physical parameters like temperature, pH, TDS, turbidity, dissolved oxygen, conductivity were measured on the spot at the time of sample collection using portable multiparameter water quality monitoring instruments (DZS-708, INESA Scientific Instruments CO. Ltd). Calibration of sensors was performed before measurement. Water samples was collected in 1-1 polyethylene bottle and filtered through 0.45μm membrane filter. Samples were stored in insulated cooler containing ice and transported to the laboratory for analysis.TN was determined using alkaline potassium persulfate digestion spectrophotometry, TP was determined using ammonium molybdate spectrophotometry. NO2+NO3 in the water sample were determined by phenol disulfonic acid method. Sample of water was collected for the determination of Zooplankton density vertically near the bottom surface (0-5 m) with plankton net (25 cm mouth diameter) and for each station, a small quantity of water (minimum of 30L) was collected at various points using water sampler. The water was then mixed and filtered through a 60-μm plankton net and preserved with formalin (final concentration of 5%). The volume of the samples was calculated based on the depth of each sampling station. The samples were preserved in 5% formalin. Zooplankton samples collected were sedimented to working volumes ranging from 30-70 ml depending on the zooplankton densities. A known volume of the sample was placed in a counting chamber and was allowed to settle.
The samples were identified to the highest taxonomic level possible and counted under an inverted microscope. Confirmation of the species was accomplished using a compound microscope. Densities were calculated in terms of the number of zooplankton individuals/m3 of river water. Species diversity index and other related indices (H’ max and equitability index) were determined using Shannon-Weiner diversity index. The different diversity indices were calculated using PRIMER (Plymouth Routines in Multivariate Ecological Research). The whole water samples were also scanned for less abundant taxa. Zooplankton densities were expressed in m-3 from the knowledge of water filtered by the net. Water samples were filtered using Whatman GF/C glass fiber filters prior to analyses of TAN, nitrate-nitrite and SRP. TAN analysis followed that of Nessler’s method after preliminary distillation using Kjeltec 2200 Auto Distillation Unit (FOSS Tecator). Concentration of TAN was determined using a spectrophotometer. NO3-NO2 was analyzed using cadmium reduction method. For the determination of SRP, the sample was filtered immediately and analysis followed that of ascorbic acid method and the concentration was determined using a DR 2010 spectrophotometer.
3. Results and Discussion
3.1. Discriminant Analysis (DA)
Discriminant analysis (DA) is a technique for classifying set of observation into predefined classes. The aim of DA is to determine the class of an observation based on a set of variables based on a set of variables known as predictors or input variables. The model is built based on a set of observations for which the classes are known. The aim of DA is to identify the variables that discriminate best between two or more groups. It is use to identify variables or the computed index to develop a rule to classify future observation into one of several groups.
Discriminant analysis (DA) was applied on the dataset to test the significance of discriminant functions and to determine the most significance physicochemical parameters associated with differences among the Upper, Middle and Lower courses of Kano River. Discriminant functions (DFs) and classification matrices obtained from standard and forward and backward stepwise modes of DA and the value of Wilk’s Lambda for each discriminant function and the corresponding significance values were presented in Table 1 and 2, 3 and 4, respectively. The observation axes of the grouping variables (upper, middle and lower courses) are presented on Figure 2.
Table 1 Standard mode classification function of discriminant analysis
|
Variable |
Lambda |
F |
df1 |
df2 |
p-value |
|
Temperature |
0.974 |
0.912 |
2 |
69 |
0.407 |
|
Turbidity |
0.766 |
10.514 |
2 |
69 |
0.000 |
|
TSS |
0.672 |
16.870 |
2 |
69 |
< 0.0001 |
|
TDS |
0.231 |
114.739 |
2 |
69 |
< 0.0001 |
|
Conductivity |
0.230 |
115.695 |
2 |
69 |
< 0.0001 |
|
Salinity |
0.219 |
122.920 |
2 |
69 |
< 0.0001 |
|
DO |
0.533 |
30.263 |
2 |
69 |
< 0.0001 |
|
pH |
0.657 |
17.972 |
2 |
69 |
< 0.0001 |
|
TAN |
0.930 |
2.603 |
2 |
69 |
0.081 |
|
NO2+NO3 |
0.954 |
1.676 |
2 |
69 |
0.195 |
|
TN |
0.845 |
6.336 |
2 |
69 |
0.003 |
|
SRP |
0.457 |
41.009 |
2 |
69 |
< 0.0001 |
|
TP |
0.796 |
8.855 |
2 |
69 |
0.000 |
|
Chlorophyll-a |
0.665 |
17.345 |
2 |
69 |
< 0.0001 |
|
Zooplankton density |
0.927 |
2.702 |
2 |
69 |
0.074 |
Table 2 Standard mode confusion matrix for cross validation result
|
From \ to |
Upper course |
Middle course |
Lower course |
Total |
% correct |
|
Upper course |
23 |
0 |
1 |
24 |
95.83% |
|
Middle course |
1 |
20 |
3 |
24 |
83.33% |
|
Lower course |
0 |
0 |
24 |
24 |
100.00% |
|
Total |
24 |
20 |
28 |
72 |
93.06% |
The spatial DA was performed on the raw data set comprising of 14 physicochemical parameters after grouping into 3 categorical classes of upper, middle and lower courses of the river. The courses of the river were the grouping variables (dependent) while all the 14 measured parameters constituted the independent variables. Using the first approach (standard mode) discriminant function and classification matrices obtained from the standard mode presented on Table 4 and 5 revealed that, turbidity, TSS, TDS, conductivity, salinity, DO, pH, TN, SRP, TP and chlorophyll-a were significant and discriminating variables. This means that, these physicochemical parameters account for the most expected variation in the Kano River system. The standard mode confusion matrices and cross validation result showed that 93.06% of cases were correctly assigned.
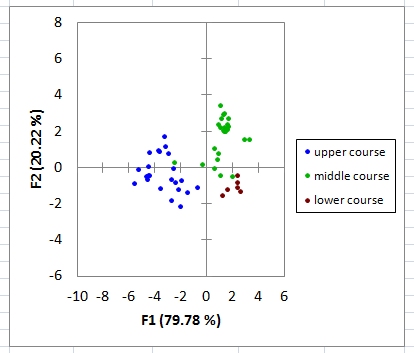
Table 3 Stepwise forward mode of classification function of discriminant analyses
|
Variable |
Lambda |
F |
df1 |
df2 |
p-value |
|
Temperature |
0.974 |
0.912 |
2 |
69 |
0.407 |
|
Turbidity |
2 |
69 |
|||
|
TSS |
0.672 |
16.870 |
2 |
69 |
< 0.0001 |
|
TDS |
2 |
69 |
|||
|
Conductivity |
2 |
69 |
|||
|
Salinity |
0.219 |
122.920 |
2 |
69 |
< 0.0001 |
|
DO |
2 |
69 |
|||
|
pH |
2 |
69 |
|||
|
TAN |
2 |
69 |
|||
|
NO2+NO3 |
0.954 |
1.676 |
2 |
69 |
0.195 |
|
TN |
2 |
69 |
|||
|
SRP |
0.457 |
41.009 |
2 |
69 |
< 0.0001 |
|
TP |
0.796 |
8.855 |
2 |
69 |
0.000 |
|
Chlorophyll-a |
0.665 |
17.345 |
2 |
69 |
< 0.0001 |
|
Zooplankton density |
2 |
69 |
|||
Table 4 Stepwise forward mode confusion matrix for cross validation result
|
From \ to |
Upper course |
Middle course |
Lower course |
Total |
% correct |
|
Upper course |
24 |
0 |
0 |
24 |
100.00% |
|
Middle course |
1 |
21 |
2 |
24 |
87.50% |
|
Lower course |
0 |
2 |
22 |
24 |
91.67% |
|
Total |
25 |
23 |
24 |
72 |
93.06% |
The forward and backward stepwise modes includes five physicochemical parameters in the models yielding 93.06% correct predictions, these modes showed that TSS, salinity, SRP, TP and chlorophyll-a as the most critical for the spatial discrimination and gave 93.06% correct cases assignation. This study is consistent with findings of Papaioannou et al. [14] in which they used DA to construct the best discriminant functions and to confirm the clusters determined by cluster analysis. The standard, forward stepwise and modes discriminant functions used seventeen and ten parameters with classification matrix correctly assigned 96.97% and 96.36% of the cases respectively. This study concluded that, DA proven to be a useful tool in recognizing the discriminant parameters in spatial variation of portable water quality. Similarly Juahir et al., [15] studied water quality pattern of seven stations located along Langat River, Malaysia. The study revealed that using stepwise forward and stepwise backward only six and seven water quality parameters respectively are statistically significance from twenty three parameters that result in water quality variation in Langat River.
3.2. Identification of river pollution sources using principal component analysis (PCA)
Principal component analysis (PCA) was used on the raw data to identify the linear combination of physicochemical parameters and to reveal the sources of water pollution in the. The result of PCA obtained showed that the Kaiser Meyer Olkin test (KMO) and Bartlett’s sphericity test are o.771 and 980.5 (df = 68, p<0.05), respectively. The Bartlett’s test indicated that the physicochemical variables were not orthogonal, but correlated therefore allowing to explain the data variability with a lesser number of variables [16]. Three principal components (PCs) having eigen values greater than 1 were extracted. The first three rotated factors with eigen value of 1 or greater than 1 are extracted using Varimax with Kaiser Normalization explaining 70.1% of the total variance of the data set.
The Principal components (PCs), loadings and variance are presented in Table 5. The highlighted variables have their absolute values of loading greater than 0.700, they represent the most important information which the interpretation of factor is based. Liu et al. [17] classified the loadings as: strong, moderate and weak for the absolute loading values of > 0.75, 0.75–0.50 and0.50–0.30, respectively.
Thus, loadings provide a measure of how each variable contributes to each principal component. The loadings are directly related to the eigen value, as the sum of the squared loadings equals the variance explained by each principal component. Factor loadings are responsible for correlations between components and selected variables and those with high loadings make the largest contribution which can be used to track the sources that are responsible for water quality variations [18]. An eigen value gives a measure of the significance of the factor and the component with the highest eigen values are the most significance. Eigen values of 1.0 or greater are considered significant [19, 20]. The first principal component (PC1) has the greatest amount of variance (31.6%) and has strong positive loading (>0.70) on salinity (0.952), conductivity (0.946), TDS (0.879), temperature (0.860) and strong negative loading on SRP (-0.804). The linear relationship between TDS, salinity and conductivity and zooplankton density, salinity and chlorophyll-a are shown in Figure 3a and 3b.
Table 5 Rotated component matrices showing loading, variance and cumulative variance
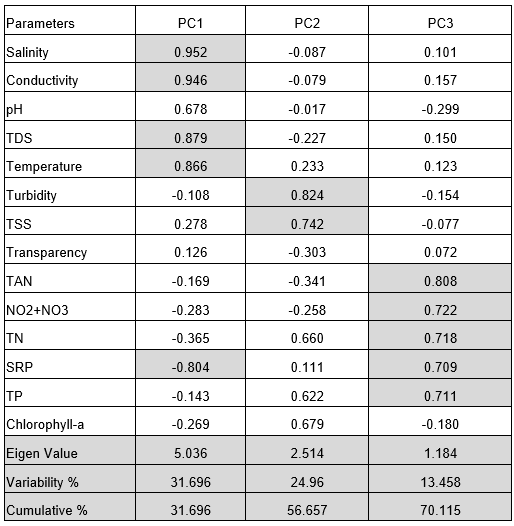
This component suggests that PC1 has a common origin from natural processes (Precipitation rate, weathering processes and soil erosion) occurring in the vicinity of the study area. Various researches conducted revealed that, conductivity of water is the sum of ionic conductance of all the ionic constitutes and the most expedient to evaluate the salinity of water is to measure its conductivity. The surface runoff from the expanding urban area appears to be triggered by aspects of the urbanization process that promote intense transport of particles into the water bodies and raised the level of TDS, and an increase in the area of agricultural land, when carried out in an uncontrolled way, can also contribute to the transport of sediments into water bodies.
PC2 explained 24.9% of the variation in the data and represented strong contributions (>0.75) by the variables turbidity and TSS. This component shows the predominance of variables which are easily influenced by anthropogenic influence and the component is related to the activities of agriculture as erosion effects occurs during cultivation of soil and rainfall events from upland areas. This behavior can be related to surface runoff and erosive processes which take place in urban and rural areas [21].
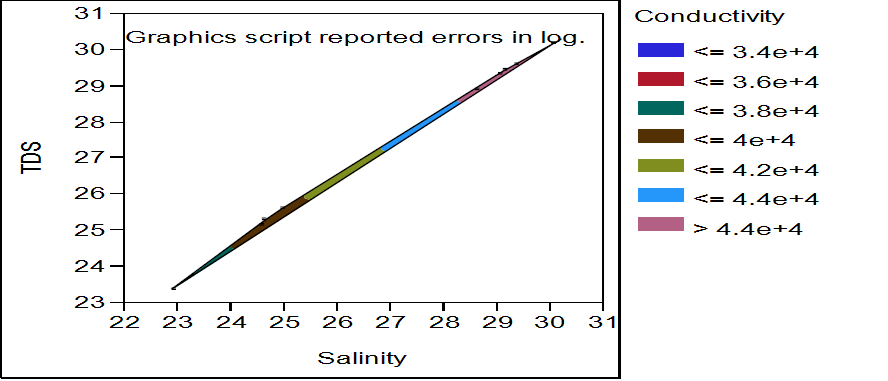
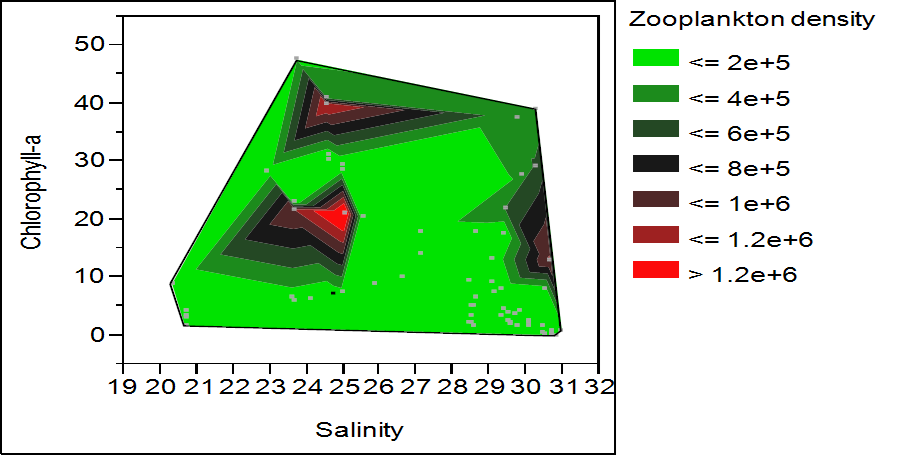
Figure 3a and 3b (3a) Contour plot showing linear relationship between TDS, salinity and conductivity (3b) Contour plot showing linear relationship between zooplankton, salinity and chloropyll-a
PC3 explained 13.4% of the total variation of the data and has strong contributions on TAN, NO2+NO3, TN, SRP and TP. This nutrient factor represents the non-point pollution of the river. Non-point sources of nitrate nitrogen in this region mainly contain agricultural runoff, as well as natural decomposition of organic and geologic deposits. Total phosphorus also ascribes to the runoff from phosphorous fertilizers and soil erosion [21]. Gholikandi et al. [23] reported that, intensive agricultural activities through application of fertilizers and pesticides have deteriorates surface water quality. Nitrogen and Phosphorous are indispensable inputs for the sustainability of agriculture; however, nutrient losses have a number of environmental consequences. Nitrogen and phosphorous can negatively affect the quality of surface water [24]. Agricultural activities that causes non-point source of pollution include poorly located or managed animal feeding operations; overgrazing; improper or excessive application of pesticides and fertilizer in agriculture. Pollutants that result from farming and ranching may include sediments, nutrients, pathogen, pesticides, metals and salts [25]. An excess of these nutrients in PC3 may lead to diverse problems such as harmful algal blooms, reduced water transparency, loss of oxygen, taste and odour problems, fish deaths and loss of biodiversity. Nutrient enrichment seriously degrades aquatic ecosystems, impairing the use of water for drinking, industry, agriculture, recreation and other purposes.
3.3 Multiple linear regression models
Multiple linear regression (MLR) models using enter method was used on the selected physicochemical parameters under study. Before running MLR, classical assumptions of the model was checked and based on the collinearity diagnostic table obtained in Table 6, none of the model dimensions had condition index equal to or above the threshold value of 30.0, none of tolerance value smaller than 0.10 and VIF statistics are less than 1.0. This indicated that there is no serious multi-collinearity problem among the predictor variables of the estimated model.
Table 6 Standardized coefficient of the parameters
|
Standardized Coefficient |
t |
Sig. |
Collinearity Statistics |
||
|
Beta |
Tolerance |
VIF |
|||
|
(Constant) |
2.042 |
0.046 |
|||
|
Temperature |
-0.037 |
-0.487 |
0.628 |
0.635 |
1.574 |
|
Turbidity |
0.168 |
1.501 |
0.139 |
0.284 |
3.517 |
|
TSS |
0.047 |
0.403 |
0.689 |
0.261 |
3.837 |
|
TDS |
0.035 |
0.118 |
0.907 |
0.212 |
24.072 |
|
Conductivity |
-0.692 |
-0.503 |
0.617 |
0.312 |
527.608 |
|
Salinity |
0.946 |
0.729 |
0.469 |
0.202 |
470.193 |
|
DO |
-0.224 |
-2.105 |
0.040 |
0.316 |
3.169 |
|
pH |
-0.058 |
-0.65 |
0.518 |
0.442 |
2.262 |
|
TAN |
0.509 |
4.249 |
0.000 |
0.249 |
4.015 |
|
NO2_NO3 |
0.175 |
1.534 |
0.131 |
0.275 |
3.631 |
|
TN |
-0.093 |
-0.752 |
0.455 |
0.233 |
4.29 |
|
SRP |
0.045 |
0.307 |
0.76 |
0.167 |
5.971 |
|
TP |
0.142 |
1.03 |
0.308 |
0.188 |
5.319 |
|
Chlorophyll a |
0.455 |
3.712 |
0.000 |
0.238 |
4.205 |
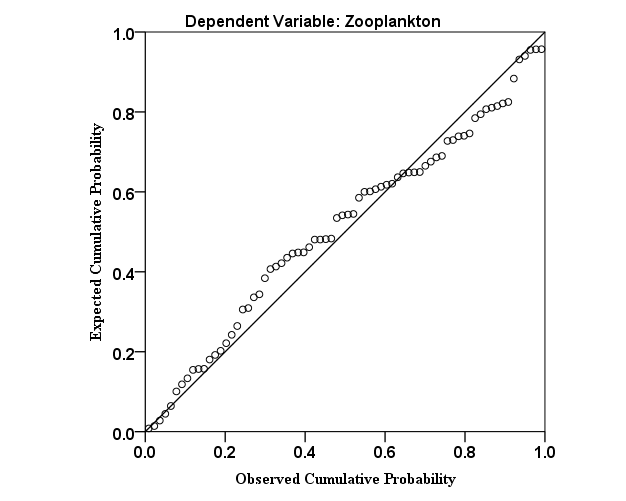
The normal P-P plot of regression standardized residuals of Figure 4 revealed all observed values fall roughly along the normality line indicating that the residuals were from a normally distributed population.
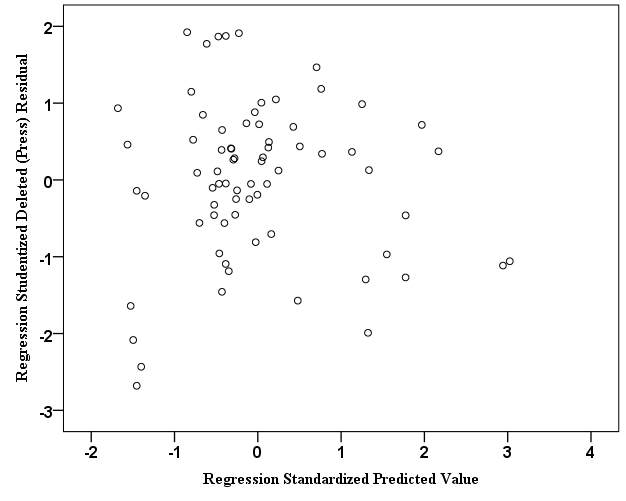
The scatter-plot as depicted in Figure 5 (standardized predicted values against observed values) indicates the relationship between the dependent variables and the predictors was linear and the residual variances were about equal or constant.
A Fourteen-predictor multiple linear regression models were proposed to explain the variation of Zooplankton abundance in Kano River (Y). Therefore, the equation of the proposed multiple linear regression models are as follows:
Y (Zooplankton density) = b0 + b1(X1) + b2(X2) + b3(X3) + b4 (X4) ….( X14)+ e
Table 7 showed that, the R-squared of 0.800 implies that the predictor variables explain 80% of the variance/variation in the density and abundance of zooplankton (Y). This is quite a good and respectable result. The ANOVA table revealed that the F-statistics (F = 14.906) was very large and the corresponding p-value was highly significant (p = 0.0001) or lower than the alpha value of 0.05. This indicates that the slope of the estimated linear regression model line is not equal to zero confirming that the research data(selected physicochemical parameters) fit the proposed multiple linear regression model of the study.
Table 7 Multiple linear regression model results
|
R |
R Square |
Adj R Square |
SE of the Estimate |
Change Statistics |
||
|
R Square Change |
F Change |
Sig. F Change |
||||
|
.894a |
0.800 |
0.746 |
0.3657 |
0.800 |
14.906 |
0.000 |
As depicted in Table 8, the largest standardized beta coefficient is salinity (0.946). This means that salinity makes the strongest unique contribution in explaining the dependent variable (zooplankton density) in Kano River profile when the variance explained by all other predictor variables in the model is controlled for. It explained that one standard deviation increase in salinity in the river water is followed by 0.946 standard deviation increase in the abundance and density of zooplankton.
Table 8 Estimates of the coefficient of the model
|
Unstandardized Coefficients |
Standardized Coefficients |
t |
Sig. |
Collinearity Statistics |
|||
|
B |
Std. Error |
Beta |
Tolerance |
VIF |
|||
|
(Constant) |
4.045 |
1.981 |
2.042 |
0.046 |
|||
|
Zooplakton density |
1.27E-06 |
0 |
0.482 |
6.418 |
0 |
0.633 |
1.58 |
|
Temperature |
-0.027 |
0.055 |
-0.037 |
-0.487 |
0.628 |
0.635 |
1.574 |
|
Turbidity |
0.003 |
0.002 |
0.168 |
1.501 |
0.139 |
0.284 |
3.517 |
|
TSS |
0 |
0 |
0.047 |
0.403 |
0.689 |
0.261 |
3.837 |
|
TDS |
0.01 |
0.086 |
0.035 |
0.118 |
0.907 |
0.042 |
24.072 |
|
Conductivity |
0 |
0 |
0.692 |
-0.503 |
0.617 |
0.002 |
527.608 |
|
Salinity |
0.222 |
0.304 |
0.946 |
0.729 |
0.469 |
0.002 |
470.193 |
|
DO |
-0.158 |
0.075 |
-0.224 |
-2.105 |
0.04 |
0.316 |
3.169 |
|
pH |
-0.083 |
0.127 |
-0.058 |
-0.65 |
0.518 |
0.442 |
2.262 |
|
TAN |
0.036 |
0.008 |
0.509 |
4.249 |
0 |
0.249 |
4.015 |
|
NO2_NO3 |
0.002 |
0.002 |
0.175 |
1.534 |
0.131 |
0.275 |
3.631 |
|
TN |
-0.001 |
0.001 |
-0.093 |
-0.752 |
0.455 |
0.233 |
4.29 |
|
SRP |
0.002 |
0.005 |
0.045 |
0.307 |
0.76 |
0.167 |
5.971 |
|
TP |
0.001 |
0.001 |
0.142 |
1.03 |
0.308 |
0.188 |
5.319 |
|
Chlorophyll a |
0.027 |
0.007 |
0.455 |
3.712 |
0 |
0.238 |
4.205 |
The standardized beta value for conductivity (0.692) is the second highest, followed by chlorophyll a (0. 455). The beta value for temperature (-0.037) and dissolved oxygen (-0.224) revealed a negative linear relationship between predictors and dependent variable, it means one standard deviation increase in temperature and dissolved oxygen is followed by 0.037 and 0.224 decreases in the abundance and density of zooplankton. Contour plot in figure 6a and 6b revealed that there is linear relationship between salinity and chlorophyll-a.
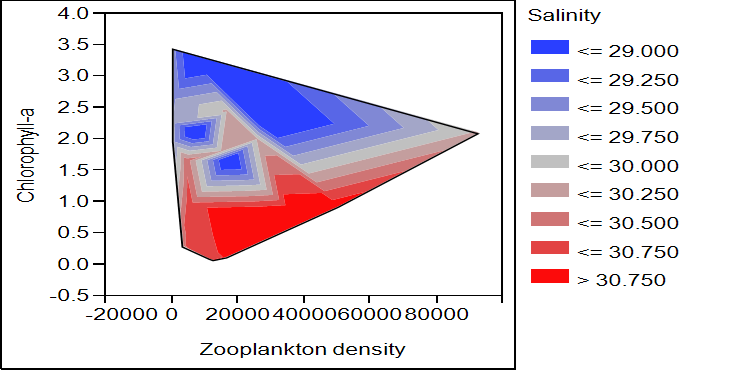
Figure 6a Contour plot showing linear relationship between choropyll-a, salinity and zooplankton density
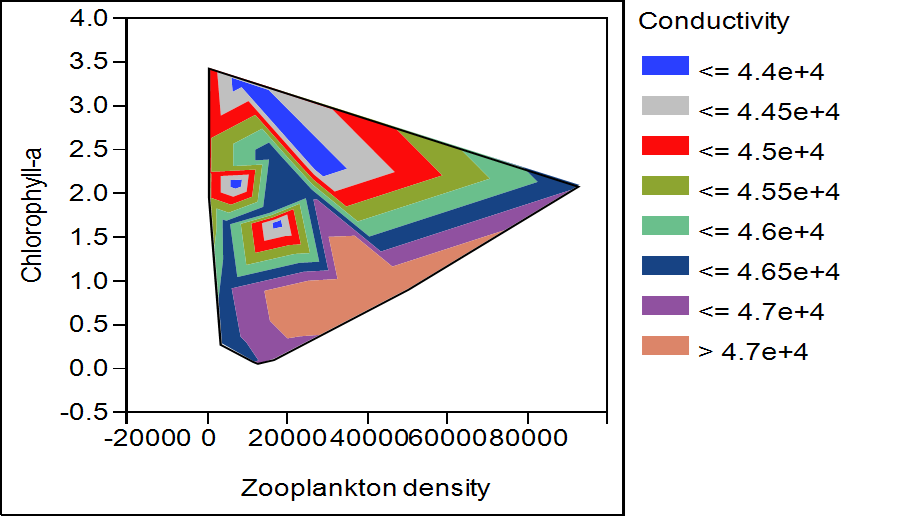
Fig. 6b Contour plot showing linear relationship between choloropyll-a, conductivity and zooplankton density.
Limitation of the Study: This study has limitation of not including aquatic ecosystem health and synects of multiple pollutants in a river system are overlooked.
Limitation of the Study: This study has limitation of not including aquatic ecosystem health and synects of multiple pollutants in a river system are overlooked.
4. Conclusions
In this study, statistical analyses were used to evaluate the spatial variations of physicochemical parameters of Kano River with a view to investigate the possible sources and to identify the significant parameters towards water quality variations. Principal component analysis (PCA) revealed surface water quality at Kano River basin was dominated by three major sources of water pollution: natural processes (precipitation, weathering processes, soil erosion), with over 30% variability, activities of anthropogenic influence such as cultivation of soil and rainfall events and non-point source through diffused sources of pollution, having no definite or specific location where discharge into a body of water. Forward and backward stepwise modes of discriminant analysis (DA) included five physicochemical parameters (TSS, salinity, TP, SRP and chlorophyll-a) explaining more than 93% of correct prediction. Multiple linear regression models revealed that the selected physicochemical parameters explained 76.4% of the total variations in the zooplankton abundance and density in Kano River profile. Effective water quality management requires that the concentration and effects of pollutants can be assessed accurately. Increased awareness of pollution and its effects has emphasized the importance of water quality management in maintaining our natural waters in a fit state for various purposes. The protection of surface water resources in the Kano River Basin is an urgent matter to permit ecologically sensitive construction and sustainable socio-economic development in the whole of the basin.
Supplementary Materials: A
Author Contributions: Conceptualization, AM. and SM.; methodology, AM.; software, HIA.; validation, AM., NIB. and SM.; formal analysis, HIA.; investigation, AM.; resources, AM.; data curation, AM.; writing—original draft preparation, AM.; writing—review and editing, AM and HIA.; visualization, AM; supervision, AM.; project administration, AM.; funding acquisition, NA. All authors have read and agreed to the published version of the manuscript.
Funding: This research received no external funding.
Data Availability Statement: NA
Acknowledgments: During the study, the author(s) used Multivariate statistical analysis for the purposes of [Validating surface water quality Analysis]. The authors have reviewed and edited the output and take full responsibility for the content of this publication.”
Conflicts of Interest: The authors declare no conflicts of interest.
Abbreviations
|
DA |
Discriminate Analysis |
|
DFs |
Discriminate Functions |
|
DO |
Dissolved Oxygen |
|
SAR |
Sodium Absorption Ratio |
|
PCA |
Principal Component Analysis |
References
- Vystana Y., Yakovlev V., Diadin D., Vergeles Y., Stolberg F. Hydrochemical characteristics and water quality assessment of surface and ground waters in the transboundary (Russia/Ukraine) Seversky Donets Basin.Environ. Earth Sci. 2015, 74, 585-596.
- Charalampous N., Kindou A., Dimitris V., Tsarpali V., Antonopoulou M., Konstantinou I., Dailianis S.
A.multidisciplinary assessment of river surface water quality in areas heavily influenced by human
activities.Arch. Environ. Contam. Tox. 2015, DOI: 10.1007/s00244-015-0152-9. - Soo, C. L., Ling, T. Y., Lee, N., and Apun, K. Assessment of the characteristics of nutrients, total
metals, and fecal coloforms in Sibu Laut River, Sarawak, Malaysia’, Appl. Water Sci. 2016, 77, 77-96. - Huang, Z., Han, L., Zang, L., Xio, W., and Tian, Y. Effects of land use patterns on stream
water quality: a case study of a small scale watershed in the Three Gorge Reservoir Area, China’,
Environ. Sci. Pollut. Res. 2016, 33, 3943-3955. - Mustapha, A., Aris, A. Z., Ramli, M. F., and Juahir, H. Temporal aspects of surfacewater quality
variation using robust statistical tools. The Scientific World Journal. 2012a, DOI:
10.1100/2012/294540. - Reddy, M. V., Babu, K. S., Balaram, V., and Satyanarayanan, M. Assessment of the effects
of municipal sewage immersed idols and boating on the heavy metal and other elemental pollution
of surface water of the eutrophic Hussainsagar Lake (Hyderabad, India)’, Environ. Monit. Assess.
2012,184, 1991–2000. - Monica, N., and Choi, K. Temporal and spatial analysis of water quality in Saemangeum
Water using multivariate statistical techniques’, Paddy Water Environ. 2016, 14, 3-17. - Varekar, V., Kamakar, S., and Jha, R. Seasonal rationalization of river water quality sampling
locations: a comparative study of the modified Sanders and multivariate statistical approach’, Environ
Sci. Pollut. Res. 2016, 33, 2308-2328. - Padma P., Sheela V. S., Suryakumari, S., Jayalakshmy, K. V., Niar, S.M., Kumar, N. C. Assessment
of water quality of a River-Dominated estuary hydrochemical parameters: a statistical approach’,
Water Qual. Expo. Health. 2016 5, 197-214. - Sethy, S. N., Syed, T. H., Kumar, A., and Sinha, D. Hydrochemical characterization and quality
assessment groundwater in parts of Southern Gangetic Plain’, Environ. Earth Sci. 2016, 75,
232-233. - Yadav, I. C., Devi, N. L., Mohan, D., Shihua, Q., Singh, S. Assessment of groundwater
quality with special special reference to arsenic in Nawalparasi district, Nepal using multivariate
statistical techniques’, Environ. Earth Sci. 2014,72,259-273. - Cabria, M. A., Barquin, J., and Penas, F. J. Modelling the spatial and seasonal variability of water
quality for entire river networks: relationship with natural and anthropogenic factors. Sci. total envron.
2016, 545, 152-162. - Marco, C., Monteiro, M. Discrimination of water quality monitoring site in River Vougal using a mixed
effect space model’, Stoch. Environ. Res. Risk Asess. 2016, 30, 607-619. - Papaioannou, A., Mavridou, A., Hadjichristodoulou, C., Papastergiou, P., Pappa, O., Dovriki, E., and
Rigas, I. Application of multivariate statistical methods for groundwater physicochemical and biological
quality assessment in the context of public health. Environ. Monit. Assess. 2010, 170, 87–97. - Juahir, H., Zain, S. M., Yusoff, M. K., Hanidza, T. I. T., Armi, A. S. M., Toriman, M. E.,and Mokhtar, M.
Spatial water quality assessment of Langat River Basin (Malaysia) using environmetric techniques’,
Environ. Monit. Assess, 2011, 173, 625–641. - Kura, N. U., Ramli, M. F., Sulaiman, W. N. A., Ibrahim, S., Aris, A. Z., Mustapha, A. Evaluation of
factors influencing the groundwater chemistry in a small tropical island of Malaysia’, Int. J. Environ.
Public Health. 2013, 10, 1861–1881. - Liu, C. W., Lin, K. H., and Kuo, Y. M. Application of factor analysis in the assessment of groundwater
quality in a blackfoot disease area in Taiwan’, Sci. Total Environ. 2003, 313, 77–89. - Huang, F., Wang, X., Lou, L., Zhou, Z., and Wu, J. Spatial variation and source apportionment of water
pollution in Qiantang River (China) using statistical techniques’,Water Res. 44, 2010, 1562–1572. - Mustapha, A.; Aris, A. Z.; Ramli, M. F; and Juahir, H. Spatio-temporal variation of surface water quality
in the downstream region of the Jakara River, north-western Nigeria: a statistical approach. Journal
Environ. Sci. Health Part A, 2012, 47, 1551-1560. - Shrestha S, Kazama F. Assessment of surface water qualityusing multivariate statistical techniques: A
case study of the Fuji river basin, Japan’, Environ. Modell. Softw. 2007, 22, 464–475. - Calijuri, M. L., Couto, E. A. Santiago, A. F.; Camargo, R. A., and Silva, M. D. Evaluation of the
influence of natural and anthropogenic processes on water quality in Karstic Region’, Water, Air, Soil,
Pollut. 2010, DOI: 10.1007/s11270-011-1012-5. - Wang, X., Cai, Q., Ye, L., and Qu, X. Evaluation of spatial and temporal variation in stream water
quality by multivariate statistical techniques: A case study of the Xiangxi River basin, China’,
Quaternary Int. 2012, DOI:org/10.1016/j.quaint.2012.15.015. - Gholikandi, G. B., Haddadi, S., Dehghanifard, E. and Tashayouie, H. R. Assessment of surface water
resources quality in Tehran province, Iran. Desalination and Water Treatment, 2012, 37 (1-3): 8–20. - Carpenter, S. R., Caraco, N. F., Correll, D. L., Howarth, R. W., Sharpley, A. N., and Smith, V. H. ‘
Nonpoint pollution of surfacewaters with phosphorus and nitrogen’, Ecol. Applications,1998, 8,
559–568. - Chawdhury, S., and Al-Zahrani, M. Water quality change in dam reservoir and shallow aquifer: analysis
on trend, seasonalvariability and data reduction’, Environ. Monit. Assess, 2011,186, 6127-6143.
Disclaimer/Publisher’s Note: The statements, opinions and data contained in all publications are solely those of the individual author(s) and contributor(s) and not of Dialogic Academic Presses (DAPresses), Dialogic Solutions Ltd and/or the editor(s). Dialogic Solutions Ltd and/or the editor(s) disclaim responsibility for any injury to people or property resulting from any ideas, methods, instructions or products referred to in the content.
How to cite this article
Cite this article
APA style shown. Use “Cite” for MLA, Chicago, IEEE, BibTeX and RIS formats.
Metrics
594
Article views
98
PDF downloads