
Measuring Human Mycotoxins Exposure Using Biomarkers - A Review
1 ✉
- 1Chester Medical School, Faculty of Health, Medicine and Society, University of Chester, Chester CH2 1BR, UK.
https://doi.org/10.66845/dstem.2026.00005
Cite this article
Related Articles
Climate Change Resilience and Adaptation Pathways for Africa’s Agricultural Sector
Francis Bisong, Asuquo Okon, Ekaba Bisong and Jackson Akor
Dialogic STEM Journal · 2026
ArticleDesign, Prototyping and Testing of Mechatronic Spinner for Domain-Based Systems Thinking
Chukwuma Ogbonnaya and Chagary Ranjan
Dialogic STEM Journal · 2026
ArticleDynamic Differential Games of Nuclear Proliferation and Preemption under Uncertainty
Innocent Adinebo Katule and Akindele Michael Okedoye
Dialogic STEM Journal · 2026
ArticleGas Chromatography Method Development and Validation for Separating Non-polar Volatile Hydrocarbons
Perpetual Eze-Idehen
Dialogic STEM Journal · 2026
Contents
Abstract
Mycotoxins are secondary toxic compounds produced by fungi of the Aspergillus, Fussarium and Penicillium species during secondary metabolism and they pose a major threat to humans and animals. Estimation of mycotoxin exposure by measuring contamination of food coupled with dietary intake questionnaires has been improved by the availability of bi-omarkers of exposure, which allow more accurate and objective exposure measurements. Biomarker assessment in biological fluids has greatly contributed to elucidating the mechanism of health impairments attributable to these toxic compounds and to studying their pharmacokinetics. The analytical methods for the determination of single mycotoxin exposure biomarkers include enzyme linked immunosorbent assay (ELISA), high performance liquid chromatography (HPLC)-fluorescent detection and Gas chromatography (GC)-electron capture, and HPLC mass spectrometry. Recent advances in liquid chromatography tandem mass spectrometry (LC-MS/MS) have revolutionised mycotoxin biomarker assessment through the analysis of multiple mycotoxins in one sample injection. Despite these current developments, efforts still need to be made towards further improvements in sampling procedures, inter-laboratory quality assurance and development of internal standards to ensure appropriate detection of biomarkers.
Keywords
Full text
Reading view1. Introduction
Mycotoxins are secondary metabolites of fungi, especially Aspergillus, Fusarium and Penicillium species contaminating 25% of food crops worldwide and therefore, are regarded as major health threats to humans and animals [1]. Aflatoxins, fumonisins, ochratoxins, deoxynivalenol and zearalenone are regarded the most worldwide concerned mycotoxins due to their frequent occurrences in cereals and cereal-based products. In evaluating the risk associated with a toxicant, biomarkers are used to provide data on contamination-related responses in a biological system or quantify the toxicant and/or its biotransformation metabolites in biological fluids. According to World Health Organisation (WHO) ‘biomarker is used in a broad sense to include almost any measurement reflecting an interaction between a biological system and an environmental agent, which may be chemical, physical or biological’ [2]. Three classes of biomarkers include biomarkers of exposure, biomarker of effect and biomarker of susceptibility. WHO [2] also defined biomarker of exposure ‘as an exogenous substance or its metabolite or the product of an interaction between a xenobiotic agent and some target molecule or cell that is measured in a compartment within an organism.’ Biomarkers of exposure are indispensable tools in the assessment of the health effects associated with mycotoxins in humans and animals as well as monitor the outcome of intervention studies geared towards mycotoxins exposure reduction. This review examines the different biomarkers of exposure for aflatoxins, ochratoxin A, fumonisins, zearalenone and deoxynivalenol and their current detection methods.
2. Single-mycotoxin biomarker methods
2.1 Ochratoxin A
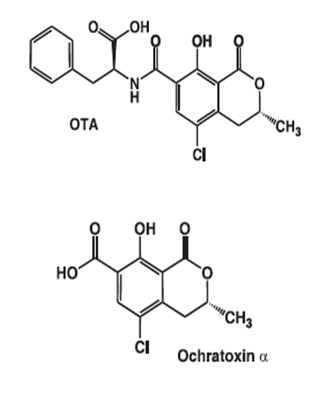
Ochratoxins are mainly produced by Aspergillus and Penicillium species and contaminate cereals, coffee, dried fruit and other products. Ochratoxins include Ochratoxin A (OTA), its methyl ester, its ethyl ester (Ochratoxin C), 4-hydroxyochratoxin A, Ochratoxin B with its methyl and ethyl esters and Ochratoxin α (Figure 1). OTA is the most toxic of all the ochratoxins and studies shows that OTA is nephrotoxic, hepatotoxic, embryotoxic, neurotoxic, immunotoxic, genotoxic and carcinogenic, and have been classified as a possible human carcinogen (group 2B) [3]. Health risk assessment of exposure to OTA and other mycotoxins were previously done by measuring their concentrations in foodstuff combined with data of food consumption and dietary habits but this failed to provide accurate data on human exposure [4].
However, with the availability of validated exposure biomarkers, the assessment of dietary exposure of humans to mycotoxins, including OTA are done by estimating their level in biological samples using biomarkers of exposure [4]. Exposure assessment using biomarkers is an indispensable tool due to its ability to provide information on mycotoxins exposure by all routes (oral, dermal, inhalation), and in situations where food contamination data are scarce or not available [5,6]. According to Scott [5], OTA binds strongly to serum albumin and/or other proteins allowing OTA to possess a long serum half-life (t1/2 35 days) and therefore, detection of OTA in blood serum is an important biomarker for human OTA exposure. In addition, urinary OTA is considered to be a human exposure biomarker [7]. The OTA concentrations in blood serum/plasma gives data for exposure over longer periods, while biomarker analysis in urine only gives information on day-to-day variations in exposure of adults and infants [4,6,8].
Several analytical methods have been employed in the detection of OTA exposure biomarkers in humans. Castegnaro et al. [9] used an HPLC-flourescence detection (HPLC-FD) method to analyse OTA in serum and urine of villagers from a region of Bulgaria with high prevalence of Balkan Endemic Nephropathy but found that the biomarkers were not directly correlated with weekly OTA intake based on OTA consumption estimated by food intake/contamination analysis [9]. Similarly, Ali et al. have used the HPLC-FD method to measure OTA exposure using serum or urine samples in Bangladeshi populations, showing frequent exposure to OTA [6,10].
In a pilot study using LC-MS/MS, OTA and OTα were simultaneously detected in the plasma and urine of 13 volunteers [11]. It was observed that OTA was the predominant form found in plasma while the OTα metabolite was mainly found in the urine. Concentrations of OTα in urine (mean: 2.88 ± 2.24 ng/mL) were higher than OTα concentrations in plasma (mean: 0.95 ± 0.46 ng/mL). In addition, urinary OTA (mean: 0.07 ± 0.05 ng/mL) was lower than the value found in plasma (mean: 0.25 ± 0.03 ng/mL) of the subjects. In a study in Spain, 72 urine samples were treated enzymatically with glucuronidase/arylsulfatase, separated with liquid extraction and examined with high performance liquid chromatography-fluorescence detection (HPLC-FLD) [12]. OTA was detected in 9 out of 72 samples (12.5%; limit of detection, 0.034 ng/mL) and OTα in 44 samples (61.1%; limit of detection, 0.023 ng/mL). Furthermore, the concentrations of OTA and OTα were 0.057-0.562ng/mL and 0.056-2.894ng/mL, respectively. They also observed that food frequency questionnaire and three-day food intake record was related to the concentration of OTA and OTα in urine, respectively. Similarly, OTA and OTα have been found in 40 urine samples from pregnant women using HPLC-FLD after liquid-liquid extraction using 1% NaHCO3 and chloroform/ispopropanol mixture (97:3, v/v) [13]. In their study, part of the samples were first extracted with liquid-liquid extraction and another part extracted after enzymatic treatments. OTA was found in 75% and 58% of the samples before and after enzymatic treatment, respectively. It was also observed that the levels of OTα increased significantly in the samples enzymatically treated.
A comparison of enzyme-linked immunosorbent assay (ELISA) and HPLC-FLD in the detection of OTA in 115 serum samples was conducted by Dohnal et al. [14]. The LOD of HPLC-FLD and ELISA was similar at 0.04 µg/L and 0.05 µg/L, respectively, with recoveries of 83 to 86% (HPLC-FLD) and close to 100% (ELISA), and there was linear correlation between both methods (r = 0.907). ELISA showed cross-reactivity of OTA antibody with other ochratoxins; ochratoxin B (OTB), Ochratoxin C (OTC) and ochratoxin α (OTα), and the presence of phenylalanine moiety in OTA molecule, as there is possibility of free phenylalanine and protein-bound phenylalanine competing with OTA antibody in ELISA [14]. ELISA was also used by Erkekog˘lu et al. [15] to assess the seasonal variation in serum ochratoxin A and 98% of the blood samples collected in summer had detectable level of OTA (0.028-1.496 ng/mL) whereas 76.1% in samples collected in winter showed OTA level in the range 0.031-0.887 ng/mL.
Immunoaffinity cleanup and HPLC-FLD have also been applied in the quantitation of OTA in plasma [17,18] and urine [7,18,19]. Pena and colleagues [18] detected OTA in urine samples by extraction with 5% NaHCO3, immunoaffinity column for cleanup and HPLC-FLD. The LOD was 0.02 ng/mL of urine with OTA recovery above 90% with relative standard deviations (RSD) of less than 9% demonstrating that the method has high accuracy and precision. Similarly, Akdemir et al. [7] showed recovery values of OTA in urine sample to be between 85.7% and 110.5% (limit of quantification: 0.006 and 0.018 ng/mL) and RSD values between 3.83 and 8.86 % (spiked concentrations: 0.02 to 1 ng/mL). This is true as the use of immunoaffinity chromatography and HPLC-FLD has been shown to increase the selectivity and sensitivity of the method [20]. However, immunoaffinity columns are only specific to OTA and there is a possibility of losing OTα as it is not retained [12].
Exposure to OTA varies significantly between climatic conditions, dietary habits and geographical location, and in several studies, there has been poor correlation between dietary intake and serum or urine OTA concentrations. However, many studies have applied the Klassen equation [5,12,15] to relate dietary intake of OTA with plasma concentrations, plasma clearance (renal filtration) and bioavailability (ko = 0.67 x Cp/0.5 = 1.34 x Cp; where ko = continuous dietary intake (ng/kg body weight/day), 0.67 = renal clearance rate (mL/kg body weight/day), 0.5 = bioavailability of OTA (fraction of OTA taken up) and Cp = plasma concentration (ng/mL).
2.2 Deoxynivalenol
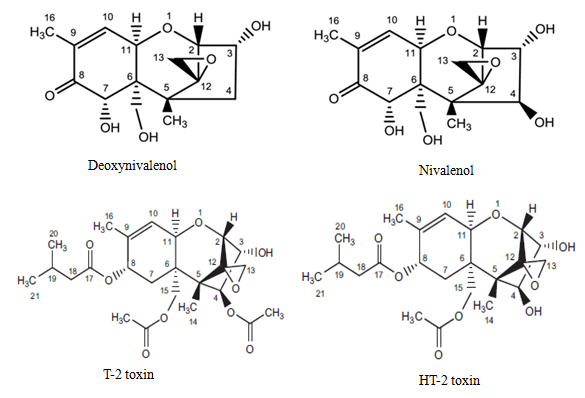
Deoxynivalenol (DON) is one of the type B trichothecenes which are toxic sesquiterpenoid mycotoxins produced by Fusarium, Stachybotrys and Myrothecium species of fungi during their growth in food and/or the environment (Figure 2). Different methods have been applied in the analysis of deoxynivalenol (DON) in urine, including gas chromatography-mass spectrometry (GC-MS), liquid chromatography-mass spectrometry (LC-MS) and liquid chromatography-tandem mass spectrometry (LC-MS/MS) after purification with immunoaffinity column (IAC), solid phase extraction (SPE), or conjugation of both IAC and SPE [21].
In 2003, Meky and colleagues pioneered the assessment of deoxynivalenol (DON) in urine using immunoaffinity enrichment and liquid chromatography-mass spectrometry [22]. This method was improved on by using 13C15-DON as an internal standard following an optimised enzymic digest [23] and this has revolutionalised the urinary assessment of DON. The method had a limit of quantification (LOQ) of 0.6 ng DON/mL urine with coefficient of variation of 6.1% and was used to assess DON exposure by measuring urinary DON levels in 25 UK volunteers. This method was applied in both DON exposure measurement and intervention studies on DON urinary levels. In the days following the intervention procedure, volunteers took normal diets (composed mainly of wheat products) and all 25 volunteers had urinary DON while only 9 of the 25 had detectable urinary DON during the intervention period. In addition, the geometric mean of urinary DON in period of normal diet (7.2 ng DON/mg creatinine; 95% CI 4.9-10.5 ng/mg) was 11-fold significantly higher than that found during the intervention process (0.6 ng/mg; 95% CI 0.4-0.9 ng/mg) indicating that intake of wheat-based foods such as bread and pasta is associated with urinary DON levels. The reduction of urinary DON in the 4-day intervention could be because of rapid excretion of the previously ingested DON; studies in rats indicate that ingested DON can be eliminated within 4 days [22] and the non-detection of conjugated DON could be due to treating the urine samples with β-glucuronidase causing liberation of DON from conjugates. In another study in UK, DON was detected in 296 of 300 (98.7%) urine samples (geometric mean: 9.42 µg DON/day; range: undetectable - 65.97 µg/day) using LC-MS after purification on immunoaffinity columns [24]. Total urinary DON (fD + DG) concentration was significantly associated with cereal consumption (p < 0.005). Similarly, total urinary DON showed significant association with cereal consumption both as a continuous variable (p < 0.005) and as a categorical variable (p < 0.005), even after creatinine adjustment [24]. Wheat-based meals were also associated with urinary DON levels like that previously reported indicating that wheat-based meals are the most common source of DON exposure in the UK [23].
In a different study, Cunha and Fernandes [21] compared the application of immunoaffinity column (IAC) and solid-phase extraction (SPE) in combination with gas chromatography-mass spectrometry (GC-MS) in the detection of deoxynivalenol and metabolites in human urine. This was the first report of the application of SPE in the extraction of DON and its metabolites followed by GC-MS analysis. In addition, they compared the effectiveness of three different β-glucuronidase enzymes (type IX from E. coli, Type I from H. pomatia and type L II from P. vulgate) usually applied in the digestion of DON-glucuronide and metabolites from human urine. It was observed that type I enzyme from H. pomatia showed the best peak area followed by type IX from E. coli and type L II from P. vulgate [21]. Meky et al.[22] also reported high efficiency of type IX enzyme from E. coli in comparison with P. vulgate, but no comparison with type I enzyme from H. pomatia was done in their study. Furthermore, comparison of chromatograms obtained shows that the octadecylsilane (C18) SPE extraction cleanup had higher chromatographic signal for DON and metabolites. Using this technique, the levels of detection and quantification ranged from 0.06 - 0.30 ng/mL and 0.2 - 1.0 ng/mL of urine, respectively. The recoveries were between 73% and 105% for fortification levels between 25 and 100 ng/mL with repeatability values ranging from 5% to 13%. The repeatability values obtained were like that previously reported [23,25-27] while the levels of quantification was similar to that by Turner et al. [23, 25] with 0.5 ng/mL urine for DON and 0.06 ng/mL for DOM-1, and by Solfrizzo et al. [26] with 0.8 ng/mL for both DON and DOM-1. However, the use of IAC cleanup and LC-MS/MS is superseeded by this method developed by Cunha and Fernandes [21] as the cost of sample preparation was reduced by using C18 SPE cleanup in combination with low volumes of extraction solvent.
Reports show un-metabolised DON and conjugated DON as the main compounds detected in human urine [23] and therefore, simultaneous measurement of free DON (fD) and DON-glucuronide (fD +DG) in urine has been recognised as a human exposure biomarker for DON intake [23,25]. Urinary fD + DG levels have been correlated with cereal intake [24] and the level of fD +DG combined has shown significant correlation with urinary free DON [28]. This is highly corroborated by a recent study in Tanzania conducted by Srey and colleagues [29] in which DON intake in children was well correlated with urinary DON. In this study, IAC was used in combination with LC-MS-ESI and the LOD was 0.5 ng DON/mL of urine. The geometric mean for DON level was 2.5 ng/mL of urine with urinary DON and fDON were found in 51% and 22 % of the urine samples from children from Tanzania aged 6-14 months, respectively. In Tanzania, correlation between DON urinary biomarkers was seen in children and mothers but in men, additional intake of DON from local maize brew was associated with the urinary DON biomarker [30]. The total DON (free + conjugated) with levels ranging from 0.5 - 28.8 ng/mL was found in urine samples from France [31], 5.0 - 78.2 ng/mL in UK [28] and 67% of urine samples (range: 1.9 - 26.2 ng/mL; mean: 16.3 ng/mL) in Portugal [21] while free DON in urine was found in 23 of 34 urine samples (0.5 to 9.3 ng/mL) in UK [28] and 2 of 13 (15%) subjects (1.8 and 8.8 ng/mL) in Portugal [21]. Although correlations between the urinary levels of DON and DON-glucuronide and dietary intakes of DON have been recorded, there is need to apply inter-laboratory surveys in order to validate their use as biomarkers of DON exposure.
De-epoxy metabolite of DON (de-epoxy-deoxynivalenol; DOM-1) has also been found in 26 of 76 (34%) urine samples from individuals exposed to DON in Normandy, France [31] and 2% of urine samples examined in UK [28]. In contrast, Turner et al [32] did not detect DOM-1 in their biomarker survey of urinary deoxynivalenol in 60 women from Shanghai, China but DON-glucuronide was found in 96.7% (mean 4.8ng DON/ml urine or 5.9ng DON/mg creatinine) of the samples using HPLC-MS. DOM-1 was not detected in urine samples of UK adults [25] and all 13 urine samples examined in a pilot study in Portugal [21]. In the French survey by Turner and colleagues, DOM-1 were mainly found in the urine samples of farmers handling cattle suggesting acquisition of animal microbiota with de-epoxidase action as DON is metabolised to DOM-1 in the rumen of cows [31]. The inconsistent detection of DOM-1 in human urine is an indication that it is possibly not a major DON metabolite in humans and therefore, may not be important exposure biomarker in the biomonitoring of human disease risk associated with DON. Interestingly, Warth et al. [33] developed a LC-MS/MS method of detecting DON and DON-3-glucuronide in human urine. This method bypasses the enzymatic digestion of DON-glucuronides and uses an internal DON-3-glucuronide standard, which allows the use of 'dilute and shoot' method removing the rigorous cleanup step. The limit of detection of DON-3-glucuronide was 3 µg/L with recovery of approximately 88% whereas LOD and recovery for DON was 6 µg/L and 101% respectively. Similarly, Sarkanji et al.[34] detected DON-3-glucuronide and DON-15-glucuronide in 97.7% of urine samples of pregnant women from Croatia using Liquid chromatography-electrospray ionisation tandem mass spectrometry (LC-ESI-MS/MS) and a 'dilute and shoot' method. These indicate the great prospects of using DON-3-glucuronide and DON-15-glucuronide as biomarkers of human DON exposure. However, the DON-3-glucuronide standard employed in these tests is not commercially available and its availability will be of great potential in the direct quantification of DON and its glucuronide metabolites. This will be beneficial in the validation of DON biomarkers for application in biomonitoring of human exposure to DON and intervention programmes.
2.3 Aflatoxins
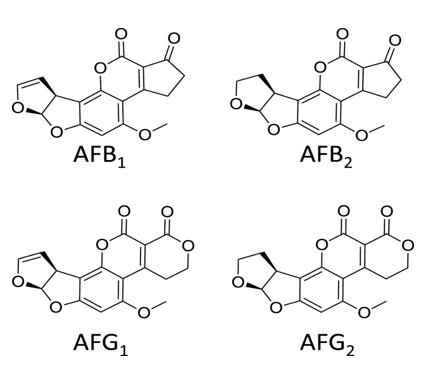
Aflatoxins are secondary metabolites of Aspergillus flavus and A. parasiticus and are one of the major contaminants of peanuts, cottonseed, corn and rice (Figure 3). The naturally occurring classes of aflatoxins are AFB1, AFB2, AFM1, AFM2, AFG1 and AFG2, and their hydroxylated metabolites commonly found in milk and urine (AFM1, AFM2) [35]. Aflatoxin B1 is the most toxic, causing acute liver toxicity that can lead to death after high exposure [36,37], and hepatocellular carcinoma, particularly in individuals with chronic hepatitis B virus infection [3], after chronic exposure. AFB1 has also been implicated in growth impairment in children [38-41] and modification of immune function [42]. The development of validated biomarkers and analytical techniques has improved research into the influence of aflatoxins on human health [43,44]. By the late 1980’s the potential of the urinary DNA adducts, as a short-term biomarker of exposure [45-47] and the serum albumin adduct as a measure of accumulated exposure over 2-3 months [48,49] had been established. Both biomarkers were further validated in studies on human populations in high exposure regions of China and Africa [50-53]. In addition, urinary aflatoxin M1 (AFM1) has been shown to have dose-dependent association with dietary consumption of AFB1 contaminated foods and therefore, used as a biomarker for short-term exposure to aflatoxins [50,54-57]. A key study that established the value of such biomarkers was the demonstration that the risk of liver cancer in a cohort of men from Shanghai region of China was enhanced in men who had tested positive for both aflatoxin exposure and hepatitis B virus infection [58]. This study used the urinary aflatoxin DNA adduct to determine aflatoxin exposure and without the use of biomarkers to confirm exposure, this study would not have been possible.
The dietary intake of aflatoxins has been reported to show significant association with the level of AFB1-albumin adduct in plasma samples [53,59] and this led to its wide application as biomarker of human aflatoxins exposure. Two approaches to measuring AFB1-albumin have generally been taken- using an ELISA method to measure adduct levels [60] or an HPLC method with either fluorescence or mass spectrometry to quantify aflatoxin B1-lysine adducts [61-63]. Over the last decade highly prevalent exposure to aflatoxin has been reported using the ELISA method for detecting serum AFB1-albumin adducts in many African countries including Tanzania, Kenya, Gambia, Senegal, and Guinea and Uganda [64-69]. Levels of AFB1-albumin were found to correlate with dietary intake of aflatoxin in Tanzanian children [70]. Mean values of AFB1-alb adduct ranged from 10 pg/mg albumin in Ugandan children to 540 pg/mg in Kenyan adolescents. Amongst this body of research, the highest levels of biomarker were recorded in Kenya in 2004 during a period of high aflatoxin contamination which resulted in acute aflatoxicosis related deaths in parts of the country [66]. These studies have shown that aflatoxin exposure can vary with season, year on year and geographically, including due to local microclimate. Other laboratories have used chromatographic separation with fluorescence or mass spectrometry detection to measure AF-lys in populations from a number of countries. For example, Leong et al. [71] applied HPLC-FLD to measure the serum AFB1-lysine adduct levels in 170 subjects from Malaysia. A total of 97% of the serum samples had AFB1-lysine adducts above the detection limit (0.4 pg/mg albumin) ranging from 0.20 to 23.16 pg/mg albumin and most of the subjects had levels ranging from 5.0 to 9.9 pg/mg albumin but there was no correlation between AFB1-lysine adduct level and dietary intake in the study population.
Reports show a significant correlation between different methods employed in the detection of serum/plasma AF-albumin (Af-alb) adduct, including ELISA and HPLC-FLD [72], RIA and HPLC-FLD and ELISA and LC-MS/MS [61,71], and HPLC-FLD and IDMS [62]. However, immunoassay methods usually give higher level of AFB1-albumin adduct than other methods, including HPLC-FLD, HPLC-IDMS and LC-MS/MS [60,61]. For instance, McCoy et al.[63] showed that there was high correlation between the concentration of aflatoxin-albumin adducts determined by ELISA and AFB1-lysine determined by HPLC-FLD or IDMS in 2 mg of albumin. In contrast, AFB1-albumin adducts concentrations determined by ELISA were 2.6 fold higher than the level of AFB1-lysine adducts probably due to incomplete enzymatic digestion, adduct formation with different amino acids, and presence of structurally related aflatoxins [63]. Jolly et al.[55] quantified serum AFB1-albumin adducts and urinary AFM1 using RIA and IAC-HPLC-FLD respectively and found a significant correlation between the levels of plasma AFB1-albumin adduct and urinary AFM1. A similar correlation has recently been reported between AFB1-albumin measured by ELISA and urinary AFM1 measured by ELISA in samples from Tanzania [73].
2.4 Zearalenone and metabolites
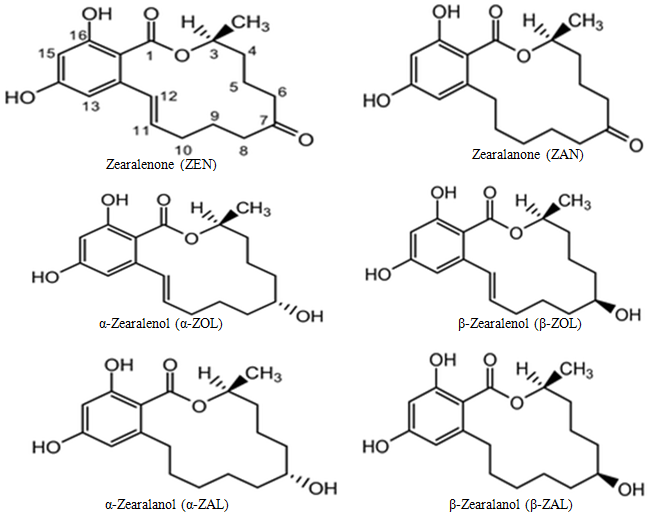
Zearalenone (ZEN) produced by Fusarium species is also considered as one of the common mycotoxins posing a threat to human and animal health [74]. ZEN and its metabolites (Figure 4), including α-zearalanol (α-ZOL), β- zearalanol (β-ZOL), α-zearalenol (α-ZAL), β-zearalenol (β-ZAL) and zearalanone (ZAN) are potent endocrine disruptors due to their resemblance to 17- β-oestradial enables them to bind to oestrogen receptor disrupting the binding of 17- β-oestradial. It has been reported to cause hyper-oestrogenism with attendant reproductive disorders and infertility problems in farm animals and humans [74].
Different analytical methods have been applied in the measurement of zearalenone, including thin-layer chromatography (TLC), HPLC-FLD, ELISA, gas chromatography/mass spectrometry (GC/MS), liquid chramotography (LC) with carbon nanotube-modified electrode, liquid chramotography with UV diode array (HPLC-DAD), liquid chromatography/mass spectrometry (LC/MS) and liquid chromatography tandem mass spectrometry (LC-MS/MS) [75,76]. Recently, LC/MS and LC/MS/MS have increasingly been applied for the detection of ZEN and its metabolites in biological fluids because these methods have been shown to determine their level in test samples with high sensitivity and selectivity regardless of the purity in biological substances [77]. ZEN and metabolites have been determined concurrently in urine samples using LC/MS/MS assays [76-82].
The metabolism of ZEN in human beings is poorly understood. Therefore, most current information concerning the presence of ZEN in physiological fluids and compartments are available as pharmacokinetic studies in animal models [76,83]. ZEN and its metabolites, including α-zearalanol (α-ZOL), β- zearalanol (β-ZOL), α-zearalenol (α-ZAL), β-zearalenol (β-ZAL) and zearalanone (ZAN) have been measured in urine (human, bovine and swine) using liquid chromatography with carbon nanotube-modified electrode [75]. The method only allowed the detection of ZEN and metabolites in the range of 5 to 50 ng/mL (LOD: 5 ng/mL) and there was no correlation between the presence of ZEN and its metabolites in urine and its exposure. Recently, glucuronides of ZEN have been detected in human urine [81]. Therefore, research should be focused on evaluating both ZEN and glucuronides in humans as possible biomarkers for ZEN. At present, it can be concluded that there is no validated biomarker of exposure for ZEN that could be used currently in assessing human exposure to ZEN.
2.5 Fumonisins
Fumonisins are mainly produced by Fusarium verticillioides, but can also be produced F. proliferatum, F. anthophilum, Alternaria alternata, etc [84]. Currently, a total of 15 types of fumonisins, classified as A, B, C or P (Figure 5), are known with Fumonisin B1 (FB1), FB2 and FB3 being the most common forms with FB1 the most toxic. FB1 is the most widely studied due to its association with oesophageal cancer [85,86] and neural tube defects [87,88].
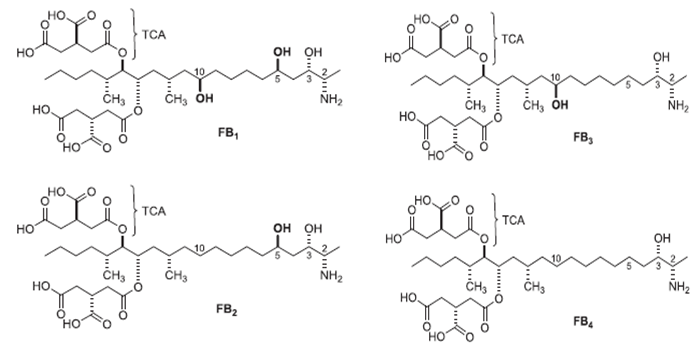
The level of sphinganine-to-aphingosine ratio, elevated sphinganine level and the concentrations of FB1 in hair and faecal samples were initially proposed as useful FB1 biomarker in animals, but there was no correlation to human fumonisin exposure [89,90]. Gong et al. [84] determined FB1 in urine samples of 75 women from Morelos, Mexico using LC-MS after extraction with Oasis MAX cartridges and reported a correlation of urinary FB1 with tortilla consumption in the Mexican population. Urinary FB1 represents only a small proportion of FB1 intake but has been shown to be a useful biomarker of exposure. In a community-based intervention to reduce fumonisin intake from maize in rural South Africa, the reduction of urinary FB1 was in good agreement with the reduction of dietary intake following the intervention [91]. In Tanzania, levels of urinary FB1 were found to vary geographically [64], with good correlation between intake for mothers and children in a family study [30], and an association between FB1 exposure and impaired child growth in children under two years of age [92]. Hence, this biomarker of FB1 exposure is proving valuable in monitoring exposure and possible health effects in areas of high exposure.
3. Multi-mycotoxins biomarker detection
The advances in analytical techniques for the simultaneous determination of multiple mycotoxins biomarkers in grains- and biological samples enable assessment of multiple exposures to different mycotoxins in humans and animals (Table 1). Ahn et al. [93] pioneered the determination of multiple mycotoxin biomarkers in urine by analysing FB1, FB2, AFM1, and OTA after concentration using three separate immunoaffinity columns. Since then, various analytical methods have been developed for multi-mycotoxin detection, including LC-MS/MS [27,81,82,94-96], GC-MS/MS [97,98], competitive fluorescent microsphere immunoassay (CFIA) [99] and liquid chromatography heated electrospray ionisation tandem mass spectrometry (LC-h-ESI-MS/MS) [100]. Mixtures of OTA, DON, AFM1, FB1, ZEN, α-ZOL and β-ZOL have also been quantified with LC-MS/MS in urine after liquid-liquid extraction (LLE) in combination with strong anion exchange (SAX) SPE clean-up with good recovery and sensitivity [101,102]. In another study, Ezekiel et al. [103] concurrently measured AFM1, DON, DON-15-O-glucuronide, FB1, OTA, FB2, ZEN, ZON-14-O-glucuronide in urine samples from Northern Nigeria using 'rapid dilute and shoot' LC-MS/MS while. Solfrizzo et al. [26] reported developing LC-ESI-MS/MS method for the simultaneous detection of urinary AFM1, OTA, DON, DOM-1, FB1, α-ZOL and β-ZOL after multi-antibody immunoaffinity cleanup and reversed phase SPE. Similarly, a new multi-mycotoxin biomarker method based on pressurised liquid extraction (PLE) and HPLC-MS/MS has been developed for the detection of multiple mycotoxins [104]. This method even permits the measurement of mycotoxins in human and laboratory animal biological fluids and tissues, including urine, faeces, blood, breast milk, amniotic fluid, liver, kidney, and lung [104], and this will be very useful in assessing both short-term and long-term exposure. Similarly, an HPLC-MS/MS method with salting-out assisted liquid-liquid extraction has been developed for multi-mycotoxins and metabolites detection in both human and pig urine [105]. Recently, Rodriguez-Carrasco et al. [97], developed and validated GC–MS/MS method to determine levels of urinary mixtures of DOM-1, DON, 3-acetyldeoxynivalenol (3-ADON), fusarenon-X (FUS-X), diacetoxyscirpenol (DAS), nivalenol (NIV), neosolaniol (NEO), HT-2, T-2, ZEN, α-ZAL, β-ZAL, ZEN, α-ZOL, and β-ZOL. This method was applied in multi-biomarker detection of mycotoxins in human urine [97,98]. In another recent study, LC-MS/MS with both 'dilute and shoot' approach after SPE and immunoaffinity clean-up was employed for multi-mycotoxin detection in urine samples [94]. DON-15-glucuronide, DON, ZEN, α-ZOL, β-ZOL, FB1 and OTA biomarkers were concurrently determined. In Cameroun-West Africa, mixtures of biomarkers of 2 to 5 mycotoxins were detected in human urine [102,106] whereas 52% of urine samples from a study in Italy had mixtures of biomarkers for DON, ZEN, FB1 and OTA with 38% having co-occurrence of biomarkers for DON, ZEN and OTA [96]. An independent inter-laboratory evaluation of the performance of LC-MS/MS in multi-mycotoxin detection showed good and comparable concentrations for DON, DOM-1, AFM1, ZEN and β-ZOL but showed unsatisfactory or questionable z scores obtained for FB1, OTA and α-ZOL [95].
Currently, most multi-mycotoxin detection methods are only carried out using urine that makes it difficult to ascertain long-term exposure and therefore, these methods should be optimised and validated for measurement in plasma/serum in order to check for long-term exposure. Similarly, efforts should be applied in synthesising more mycotoxin conjugates, including α-zearalenol glucuronide, β- zearalenol glucuronide, OTA glucuronide, and ochratoxin α glucuronide for future calibration and use in multi-mycotoxin methods [81] as these will give rise to novel ways of exposure assessment. Worthy of note is that the multi-biomarker methods are very useful as it has allowed the detection of analytes (e.g. DON-3-GlcA, DON-15GlcA and ZEN-14-GlcA) which were not previously detected using single biomarker methods and have improved the understanding of mycotoxins exposure assessment. In addition, it removes the burden encountered in extraction, clean-up and operating time needed in mycotoxins determination using single biomarker detection method as multiple mycotoxins can be analysed simultaneously in a single run using the same sample with increased sample throughput. However, one note of caution is that the sensitivity of these methods compared to some of the single biomarker methods already discussed is not always good, which may be an issue for some epidemiological studies of the effects of exposure.
Table 1. Summary of landmark studies on human exposure to mixture of mycotoxins using LC-MS/MS multi-biomarker methods.
| References |
Country |
No. of subjects |
Individuals examined |
No of positive samples (%) |
Analytes detected |
Co-exposure in a single individual |
|
Ahn et al. [93] |
Korea** |
12 |
11 adults, 1 child |
12 (100%) |
AFM1, OTA |
AFM1, OTA |
|
Rubert et al. [27] |
Spain** |
27 |
Adults |
Not stated |
AFG2, OTA, DON |
Not stated |
|
Solfrizzo et al. [26] |
Italy** |
10 |
Adults |
10 (100%) |
OTA, DON |
DON, OTA |
|
Warth et al. [81] |
Austria** |
27 |
Adults |
26 (96%) |
DON, DON-3-GlcA, DON-15-GlcA |
DON, DON-3-GlcA, DON-15-GlcA |
|
Warth et al. [82] |
Cameroon** |
175 |
145 HIV-positive adults, 30 HIV-negative adults |
110 (63%) |
AFM1, OTA, FB1, FB2, DON, DON-3-GlcA, DON-15-GlcA, NIV, ZEN, ZEN-14-GlcA, α-ZOL |
AFM1, OTA, FB1, FB2, DON, DON-3-GlcA, DON-15-GlcA, NIV |
|
Ediage et al. [101] |
Belgium** |
40 |
Adults |
9 (23%) |
DON, OTA, OTα, 4-OH-OTA, ZEN, CIT, β-ZOL |
DON, OTA, OTα, ZEN, β-ZOL |
|
Shephard et al. [94] |
South Africa** |
53 |
Adult women |
53 (100%) |
OTA, FB1, DON, DON-3-GlcA, DON-15-GlcA, NIV, ZEN, ZEN-14-GlcA, α-ZOL, β-ZOL |
OTA, FB1, DON, DON-3-GlcA, DON-15-GlcA, ZEN, ZEN-14-GlcA, α-ZOL, β-ZOL |
|
Rodriguez-Carrasco et al. [97] |
Valencia** |
54 |
38 adults, 16 children |
37 (68.5%) |
HT-2, NIV, DON |
DON-HT2, DON-NIV |
|
Ezekiel et al. [103] |
Nigeria** |
120 |
81 adults, 20 adolescents, 19 children |
61 (50.8%) |
AFM1, DON, DON-15-GlcA, FB1, FB2, OTA, ZEN, ZEN-14-GlcA |
Distribution of mycotoxins: 75% (46/61) had a single mycotoxin and 25% (15/61) had more than 1 mycotoxin [8 had 2 different mycotoxins, 5 had 3 different mycotoxins, 2 had 4 different mycotoxins, 7 had more than one mycotoxin/metabolite]. |
|
Cao et al. [104] |
China* |
10 |
6 men, 1 pregnant woman, 3 lactating women |
Not stated |
AFB1, AFB2, HT-2, DON, DOM-1, ZEN, α-ZOL, β-ZOL, FB1, FB2, AFM1, OTA, NEO, T-2 Triol, |
3 samples had AFBs and FBs. |
|
Abia et al. [106] |
Cameroon** |
145 HIV-positive adults (29 male, 116 female), 30 HIV-negative adults |
110 (63%) |
DON, NIV, ZEN, OTA, FB1, FB2, DON-15-GlcA, DON-3-GlcA, ZEN-14-GlcA, α-ZOL, AFM1 |
DON, OTA, NIV, FB1, ZEN, AFM1, FB2 |
|
|
Ediage et al. [102] |
Cameroon** |
220 |
220 children |
160 (73%) |
OTA, DON, AFM1, FB1, ZEN, α-ZOL, β-ZOL |
Co-occurrence of 2, 3 and 4 mycotoxins was 35%, 5% and 5%, respectively. |
|
Solfrizzo et al. [96] |
Italy** |
52 |
26 males, 26 females |
52 (100%) |
DON, OTA, AFM1, FB1, ZEN, α-ZOL, β-ZOL |
Distribution of Mycotoxin mixtures in samples: 2 (DON, ZEN, FB1, OTA, AFB1); 27 (DON, ZEN, FB1, OTA); 20 (DON, ZEN, OTA); 1 (DON, ZEN, OTA, AFB1); 2 (ZEN and OTA). |
|
Gerding et al. [107] |
Germany** |
101 |
Adult volunteers |
87% |
DON, ZEN, CIT, T-2, ENNB, DON-3-GlcA, ZEN-14-GlcA, DH-CIT |
DON-ENNB-ZEN, DON-CIT-T-2, DON-CIT, DON-ZEN-DON-ENNB |
|
Gerding et al. [108] |
Bangladish**, Germany**, Haiti** |
287 |
95 adult Bangladeshis, 50 adult Germans, 142 adult Haitians |
Bangladish (87%), Germany (80%), Haiti (68%) |
DON, OTA, CIT, ENNB, AFM1, FB1, α-ZOL, DON-3-GlcA, DH-CIT |
DON-CIT-OTA-FB1, DON-CIT-OTA, DON-OTA-ENNB, CIT-OTA-ENNB, CIT-OTA-FB1, AFM1-CIT-OTA, AFM1-CIT-DON, ENNB-OTA, DON-OTA, CIT-OTA, CIT-FB1, CIT-ENNB, AFM1-CIT |
*Urine, faeces, breast milk and amniotic fluid were analysed. **Only urine samples were analysed. Abbreviations used: NEO - Neosolaniol; AFB1 - Aflatoxin B1; DON - Deoxynivalenol; ZEN - Zearalenone; OTA - Ochratoxin A; NIV - Nivalenol; AFM1 - Aflatoxin M1; AFG2 - Aflatoxin G2; FB1 - Fumonisin B1; FB2 - Fumonisin B2; ZOL - Zearalenol; ZEN-14-GlcA - Zeralenone-14-O-glucuronide; α-ZOL-14-GlcA - α-Zearalenol-14-O-glucuronide; α-ZOL-7-GlcA - α-Zearalenol-7-O-glucuronide; β-ZOL-14-GlcA - β-Zearalenol-14-O-glucuronide; β-ZOL-16-GlcA - β-Zearalenol-16-O-glucuronide; DON-15-GlcA - Deoxynivalenol-15-glucuronide; DON-3-GlcA - Deoxynivalenol-3-glucuronide; DOM-1 - de-epoxy-deoxynivalenol; CIT - Citrinin; ENNB - Enniatin B; DH-CIT - Dihydrocitrinone.
4. Conclusions
Several mycotoxin exposure biomarkers are currently available, including AF-lysine adducts, urinary AFM1, AF-DNA adducts for AF, urinary FB1 for fumonisins, urinary DON and DON-glucuronides for DON, and potentially, urinary ZEN and α-ZOL for ZEN exposure. The improvements in analytical techniques for the simultaneous determination of multiple mycotoxins biomarkers in grains and biological samples promise assessment of multiple exposures to different mycotoxins in humans and animals and have also enabled the validation of different mycotoxin exposure biomarkers. However, efforts are still required to improve sample preparation procedures, inter-laboratory quality assurance and development of internal standards to ensure appropriate detection of biomarkers.
Supplementary Materials
NA
Author Contributions
Conceptualization, UE.; methodology, UE.; data analysis, UE. writing—original draft preparation, UE.; writing—review and editing, UE. I have read and agreed to the published version of the manuscript.
Funding
No funding was received in the preparation for the article.
Data Availability Statement
Available on request
Acknowledgments
NA
Conflicts of Interest
The author declares no conflicts of interest.
References
- Council for Agricultural Science and Technology (CAST): Mycotoxins, risks in plants, animal and human systems. Ames. IA. Council for Agricultural Science and Technology 2003.
- WHO; World Health Organisation.: Biomarkers and risk assessment: concepts and principles. [ISBN 92 4 157155 1; ISSN 0250-863X], WHO: Geneva. 1993. http://www.inchem.org/documents/ehc/ehc/ehc155.htm#PartNumber:1 [Acessed on 01 February, 2017].
- IARC; International Agency for Research on Cancer.: IARC monographs on the evaluation of carcinogenic risks to humans, vol. 82. Lyon, International Agency for Research on Cancer 2002.
- Duarte, S. C.; Pena, A.; Lino, C. M. Human ochratoxin A biomarkers-From exposure to effect. Critical Review in Toxicology 2011, 41, 187-212.
- Scott, P. M. Biomarkers of human exposure to ochratoxin A. Food Additives and Contaminants 2005, 22 (S1), 99-107.
- Ali, N.; Blaszkewicz, M.; Manirujjaman, M.; Prveen, R.; Nahid, A. A.; Mahmood, S.; Rahman, M.; Hossain, K.; Degen, G. H. Biomonitoring of ochratotoxin A in blood plasma and exposure assessment of adult students in Bangladesh. Molecular Nutrition and Food Research 2014, 00: 1-7. doi: 10.1002/mnfr.201400403
- Akdemir, C.; Ulker, O.C.; Basaran, A.; Ozkaya, S.; Karakaya, A. Estimation of Ochratoxin A in some Turkish populations: an analysis of urine as a simple sensitive and relaible biomarker. Food and Chemical Toxicology 2010, 48, 877–882.
- Gilbert, J.; Brereton, P.; MacDonald, S. Assessment of dietary exposure to ochratoxin A in the UK using duplicate diet approach and analysis of urine and plasma samples. Food Additives and Contaminants 2001, 18, 1088– 1093.
- Castegnaro, M.; Canadas, D.; Vrabcheva, T.; Petkova-Bocharova, T.; Chenozemsky, I.N.; Pfohl-Leszkowicz, A. Balkan Endemic Nephropathy: Role of ochratoxins A through biomarkers. Molecular Nutrition and Food Research 2006, 50, 519-529.
- Ali, N.; Blaszkewicz, M.; Alim A.; Hossain, K.; Degen, G. H. Urinary biomarkers of ochratoxin A and citrinin exposure in two Bangladeshi cohorts: follow-up study on regional and seasonal influences. Archives of Toxicology 2016, 90, 2683-2697.
- Munoz, K.; Blaszkewicz, M.; Degen, G. H. Simultaneous analysis of Ochratoxin A and its major metabolite ochratoxin alpha in plasma and urine for advanced biomonitoring of the mycotoxin. Journal of Chromatography B 2010, 878, 2623-2629.
- Coronel, M. B.; Martin, S.; Terrago, M.; Cano-Sancho, G.; Ramos, A. J.; Sanchis, V. Ochratoxin A and its metabolite ochratoxin alpha in urine and assessment of the exposure of inhabitants of Lleida, Spain. Food and Chemical Toxicology, 2011b, 49, 1436-1442.
- Klapec, T., Sarkanji, B., Banjari, I., Strelec, I.: Urinary ochratoxin A and ochratoxin alpha in pregnant women. Food and Chemical Toxicology 2012, 50, 4487-4492.
- Dohnal, V.; Dvorak, V.; Malir, F.; Ostry, V.; Roubal, T. A comparison of ELISA and HPLC methods for determination of ochratoxin A in human blood serum in the Czech Republic. Food and Chemical Toxicology 2013, 62, 427-431.
- Erkekog˘lu, P.; Sabuncuog˘lu, S.; Aydın, S.; Sahin, G.; Giray, B. Determination of seasonal variations in serum ochratoxin A levels in healthy population living in some regions of Turkey by enzyme-linked immunosorbent assay. Toxicon 2010, 55, 507-513.
- Ueno, Y.; Maki, S.; Lin, J; Furuya, M.; Sugiura, Y.; Kawamura, O. A 4-Year Study of Plasma Ochratoxin A in a Selected Population in Tokyo by Immunoassay and Immunoaffinity Column- linked HPLC. Food and Chemical Toxicology 1998, 36, 445-449.
- Coronel, M. B.; Sanchis, V.; Ramos, A. J.; Marin, S. Ochratoxin A in adult population of Lleida, Spain: Presence in blood plasma and consumption in different regions and seasons. Food and Chemical Toxicology 2011a, 49, 2697-2705.
- Pena, A.; Seifrtova, M.; Lino, C.; Silveira, I.; Solich, P. Estimation of ochratoxin A in Portuguese population: new data on the occurrence in human urine by high performance liquid chromatography with fluorescence detection. Food and Chemical Toxicology 2006, 44, 1449-1454.
- Duarte, S. C.; Alves, M. R.; Pena, A.; Lino C. M. Determinants of ochratoxin A exposure - A one year follow-up study of urine levels. International Journal of Hygiene and Environmental Health 2012, 15, 360-367.
- Malir, F.; Ostry, V.; Dofkova, M.; Roubal, T.; Dvorak, V.; Dohnal, V. Ochratoxin A levels in blood serum of Czech women in the first trimester of pregnancy and its correspondence with dietary intake of the mycotoxin contaminant. Biomarkers 2013, 1–6. DOI: 10.3109/1354750X.2013.845609
- Cunha, S. C.; Fernandes, J. O. Development and validation of a gas chromatography-mass spectrometry method for determination of deoxynivalenol and its metabolites in human urine. Food and Chemical Toxicology 2012, 50, 1019-1026.
- Meky, F. A.; Turner, P. C.; Ashcroft, A. E.; Miller, J.D.; Qiao, Y.L.; Roth, M.J.; Wild, C.P. Development of a urinary biomarker of human exposure to deoxynivalenol. Food and Chemical Toxicology 2003, 41, 265–273.
- Turner, P. C.; Burley, V. J.; Rothwell, J. A.; White, K. L. M.; Cade, J. E.; Wild, C. P. Dietary wheat reduction decreases the level of urinary deoxynivalenol in UK adults. Journal of Exposure Science and Environmental Epidemiology 2008a, 18, 392-399.
- Turner, P. C.; Rothwell, J. A.; White, K. L. M.; Gong, Y. Y.; Cade, J. E.; Wild, C. P. Urinary deoxynivalenol is correlated with cereal intake in individuals from the United Kingdom. Environmental Health Perspectives 2008b, 116 (1), 21-25.
- Turner, P. C.; White, K. L. M.; Burley, V. J.; Hopton, R. P.; Rajendram, A.; Fisher, J.; cade, J. E.; Wild, C. P. A comparison of deoxynivalenol intake and urinary deoxynivalenol in UK adults. Biomarkers 2010a, 15 (6), 553-562.
- Soffrizo, M.; Gambacorta, L.; Lattanzio, V.M T.; Powers, S.; Visconti, A. Simultaneous LC-MS/MS determination of aflatoxin M1, ochratoxin A, deoxynivalenol, de-epoxydeoxynivalenol, α and β-zearalenols and fumonisin B1 in human urine as a multi-biomarker method to assess exposure to mycotoxins. Analytical and Bioanalytical Chemistry 2011, 409(9), 2831-2841.
- Rubert, J.; Soriano, J. M.; Manes, J.; Solar, C. Rapid mycotoxin analysis in human urine: a pilot study. Food and Chemical Toxicology 2011, 49, 2299-2304.
- Turner, P. C.; Hopton, R. P.; White, K. L. M.; Fisher, J.; Cade, J. E.; Wild, C. P. Assessment of deoxynivalenol metabolite profiles in UK adults. Food and Chemical Toxicology, 2011a, 49, 132-135.
- Srey, C.; Kimanya, M.E.; Routledge, M.N.; Shirima, C.P.; Gong, Y.Y. Deoxynivalenol exposure assessment in young children in Tanzania. Molecular Nutrition and Food Research 2014, 58, 1574–1580.
- Gong, Y.Y.; Shirima, C.P.; Srey, C.; Kimanya, M.E.; Routledge, M.N. Doexynivalenol and fumonisin exposure in children and adults in a family study in Tanzania. World Mycotoxin Journal 2015, 8, 553-560.
- Turner, P. C.; Hopton, R. P.; Lecluse, Y.; White, K. L. M.; Fisher, J.; Lebailly, P. Determinants of urinary deoxynivalenol and de-epoxy deoxynivalenol in male farmers from Normandy, France. Journal of Agricultural and Food Chemistry 2010b, 58, 5206-5212.
- Turner, P. C.; Ji, B. T.; Shui, X. O.; Weng, W.; Chow, W. H.; Gao, Y. T.; Hardie, L. J. A biomarker survey of urinary deoxynivalenol in China: the Shanghai Women’s Health study. Food Additives and Contamination Part A: Chemical Analysis and Control exposure Risk Assessment 2011b, 28 (9), 1220-1223.
- Warth, B.; Sulyok, M.; Berthiller, F.; Schhmacher, R.; Fruhmann, P.; Hametner, C.; Adam, G.; Fröhlich, J.; Krska, R. Direct quantification of deoxynivalenol glucuronide in human urine as biomarker of exposure to the Fusarium mycotoxin deoxynivalenol. Analytical and Bioanalytical Chemistry 2011, 401, 195-200.
- Šarkanj, B.; Warth, B.; Uhlig, S.; Abia, W. A.; Sulyok, M.; Klapec, T.; Krska, R.; Banjari, I. Urinary analysis reveals high deoxynivalenol exposure in pregnant women from Croatia. Food and Chemical Toxicology 2013, 62, 231-237.
- Kensler, T. W.; Roebuck, B. D.; Wogan, G. N.; Groopman, J. D. Aflatoxin: a 50 year odyssey of mechanistic and translational research. Toxicological Science 2011, 99, S28-48.
- Azziz-Baumgartner, E.; Lindblade, K.; Gieseker, K.; Rogers, H. S.; Kieszak, S.; Njapau, H.; Schleicher, R.; McCoy, L. F.; Misore, A.; DeCock, K.; Rubin, C.; Slutsker, L.; the Aflatoxin Investigative Group. Case-control study of an acute aflatoxicosis outbreak, Kenya, 2004. Environmental Health Perspectives 2005, 113(12), 1779-1783.
- Probst, C.; Njapau, H.; Cotty, P. J. Outbreak of an acute aflatoxicosis in Kenya in 2004: identification of the causal agent. Applied and Environmental Microbiology 2007, 73(8), 2762-2764.
- Gong, Y. Y.; Cardwell, K. F.; Hounsa, A.; Egal, S.; Turner, P. C.; Hall, A. J.; Wild, C. P. Dietary aflatoxin exposure and impaired growth in young children from Benin and Togo: cross sectional study. British Medical Journal 2002, 325, 20-21.
- Gong, Y. Y.; Hounsa, A.; Egal, S.; Turner, P.C.; Sutcliffe, A. E.; Hall, A. J.; Cardwell, K.; Wild, C. P. Postweaning Exposure to Aflatoxin Results in Impaired Child Growth: A Longitudinal Study in Benin, West Africa. Environmental Health Perspectives 2004, 112, 1334–1338.
- Turner, P. C.; Collinson, A. C.; Cheung, Y. B.; Gong, Y. Y.; Hall, A. J.; Prentice, A. M.; Wild, C. P. Aflatoxin exposure in utero causes growth faltering in Gambian infants. International Journal of Epidemiology 2007, 36, 1119–1125.
- Chaytor, A. C.; See, M. T.; Hansen, J. A.; De Souza, A. L. P.; Middleton, T. F.; Kim, S. W. Effects of chronic exposure of diets with reduced concentrations of aflatoxin and deoxynivalenol on growth and immune status of pigs. Journal of Animal Science 2011, 89(1), 124-135.
- Jiang, Y. I.; Jolly, P. E.; Ellis, W. O.; Wang, J. S.; Phillips, T. D.; Williams, J. H. Aflatoxin B1 albumin adduct levels and cellular immune status in Ghanaians. International Immunology 2005, 17(6), 807-814.
- Groopman, J. D.; Wogan, G. N.; Roebuck, B. D.; Kensler, T. W. Molecular biomarkers for aflatoxins and their application to human cancer prevention. Cancer Research 1994, 54, S1907-1911.
- Routledge, M.N.; Gong, Y.Y. Developing biomarkers of human exposure to mycotoxins. (Ed) S De Saeger, In Determining mycotoxins and mycotoxigenic fungi in food and feed. Woodhead Publishing, Cambridge, UK, 2011.
- Groopman, J.D.; Trudel, L.J.; Marshakrothstein, A.; Wogan, G.N. High-affinity monoclonal-antibodies recognizing aflatoxins and aflatoxin-DNA adducts. Proceedings of the American Association for Cancer Research 1984, 25, 98-98.
- Groopman, J. D.; Donahue, P. R.; Zhu, J.; Chen, J.; Wogan, G. N. Aflatoxin metabolism in humans: detection of metabolites and nucleic acid adducts in urine by affinity chromatography. Proceedings of the National Academy of Science 1985, 82, 6492-6497.
- Groopman, J.D.; Cain, L.G.; Kensler, T.W.; Harris, C.C. Aflatoxin Exposure in Human Populations: Measurements and Relationship to Cancer. CRC Critical Reviews in Toxicology 1988, 19(2), 113-145.
- Wild, C.P.; Garner, R.C.; Montesano, R.; Tursi, F. Aflatoxin B1 binding to plasma albumin and liver DNA upon chronic administration to rats. Carcinogenesis 1986, 7, 853-858.
- Gan, L-S.; Skipper, P. L.; Peng, X-C.; Groopman, J. O.; Chen, I-S.; Wogan, G. N.; Tannenbaum,S. R. Serum albumin adducts in the molecular epidemiology of aflatoxin carcinogenesis: correlation with aflatoxin B1 intake and urinary excretion of aflatoxin M1. Carcinogenesis 1988, 9, 1323-1325.
- Groopman, J. D.; Jiaqi, Z.; Donahue, P. R.; Pikul, A.; Lisheng, Z.; Jun-shi, C.; Wogan, G. N. Molecular dosimetry of urinary aflatoxin-DNA adducts in people living in Guangxi Autonomous Region, People's Republic of China. Cancer Research 1992a, 52, 45-52.
- Groopman, J. D.; Hall, A. J.; Whittle, H.; Hudson, G. J.; Wogan, G. N.; Montesano, R.; Wild, C. P. Molecular dosimetry of aflatoxin-N7-Guanine in human urine obtained in the Gambia, West Africa. Cancer Epidemiology, Biomarkers and Prevention 1992b, 1, 221-227.
- Groopman, J.D.; Wild, C.P.; Hasler, J.; Junshi, C.; Wogan, G.N.; Kensler, T.W. Molecular epidemiology of aflatoxin exposures: validation of aflatoxin-N7-guanine levels in urine as a biomarker in experimental rat models and humans. Environmental Health Perspectives 1993, 99,107-113.
- Wild, C. P.; Hudson, G. J.; Sabbioni, G.; Chapot, B.; Hall, A. J.; Wogan, G. N.; Whittle, H.; Montesano, R.; Groopman, J. D. Dietary intake of aflatoxins and the level of albumin-bound aflatoxin in peripheral blood in the Gambia, West Africa. Cancer Epidemiology, Biomarkers and Prevention 1992, 1, 229-234.
- Zhu, J. Q.; Zhang, L. S.; Hu, X.; Xiao, Y.; Chen, J. S.; Xu, Y. C.; Fremy, J.; Chu F. S. Correlation of dietary aflatoxin B1 levels with excretion of aflatoxin M1 in human urine. Cancer Research 1987, 47,1848-1852.
- Jolly, P.; Jiang, Y.; Ellis, W.; Awuah, R.; Nnedu, O.; Philips, T.; Wang, J. S.; Afriye-Gyawu, E.; Tang, L.; Person, S.; Williams, J.; Jolly, C. Determinants of aflatoxin levels in Ghana: Sociodemographic factors, knowledge of aflatoxin and food handling and consumption practices. International Journal of Hygiene and Environmental Health 2006, 209, 345-358.
- Mitchell, N. J.; Kumi, J.; Johnson, N. M.; Dotse, E.; Marroquin-Cardona, A.; Wang, J. S.; Jolly, P. E.; Ankrah, N. A.; Phillips, T. D. Reduction in the urinary aflatoxin M1 biomarker as an early indicator of the efficacy of dietary interventions to reduce exposure to aflatoxins. Biomarkers 2013, 18(5), 391-398.
- Jager, A. V.; Tonin, F. G.; Souto, P. C. M. C.; Privatti, R. T.; Oliveira, C. A. F. Determination of urinary biomarkers for assessment of short-term human exposure of aflatoxins in Sao Paulo, Brazil. Toxins 2014, 6, 1996-2007.
- Qian, G.S.; Ross, R.K.; Yu, M.C.; Yuan, J.M.; Gao, Y.T.; Henderson, B.E.; Wogan, G.N.; Groopman, J.D. A follow-up study of urinary markers of aflatoxin exposure and liver cancer risk in Shanghai, People's Republic of China. Cancer Epidemiology and Prevention Biomarkers 1994, 3(1), 3-10.
- Egal, S.; Hounsa, A.; Gong, Y. Y.; Turner, P. C.; Wild, C. P.; Hall, A. J.; Hell, K.; Cardwell, K. F. Dietary exposure to aflatoxin from maize and groundnut in young children from Benin and Togo, West Africa. International Journal of Food Microbiology 2005, 104, 215-224.
- Chapot, B.; Wild, C.P. ELISA for quantification of aflatoxin-albumin and their application to human exposure assessment. In: Warthol, M.; van Velzer, D.; Bullock, G.R.; editors. Techniques in diagnostic pathology. Vol. 2. London: Academic Press 1991, 135–55.
- Scholl, P. F.; Turner, P. C.; Sutcliffe, A. E.; Sylla, A.; Diallo, M. S.; Friesen, M. D.; Groopman, J. D.; Wild, C. P. Quantitative comparison of aflatoxin B1 serum albumin adducts in humans by isotope dilution mass spectrometry and ELISA. Cancer Epidemiology, Biomarkers and Prevention 2006, 15, 823-826.
- Scholl, P.F.; Groopman, J.D. Long term stability of human aflatoxin B1 albumin adducts assessed by isotope dilution mass spectrometry and HPLC-fluorescence. Cancer Epidemiology, Biomarkers and Prevention 2008, 17(6), 1436-1439.
- McCoy, L. F.; Scholl, P. F.; Sutcliffe, A. E.; Kieszak, S. M.; Powers, C. D.; Rogers, H. S.; Gong, Y. Y.; Groopman, J. D.; Wild, C. P.; Schleicher, R. L. Human aflatoxin albumin adducts quantitatively compared by ELISA, HPLC with fluorescent detection, and HPLC with isotope dilution mass spectrometry. Cancer Epidemiology, Biomarkers and Prevention 2008, 17, 1653-1657.
- Shirima C.P.; Kimanya M.E.; Kinabo J.L.; Routledge M.N.; Srey C.; Wild C.P.; Gong Y.Y. Dietary exposure to aflatoxin and fumonisin among Tanzanian children as determined using biomarkers of exposure. Molecular Nutrition and Food Research 2013, 57, 1874-1881.
- Castelino, J.M.; Dominguez-Salas, P.; Routledge, M.N.; Prentice, A.M.; Moore, S.E.; Hennig, B.J.; Wild, C.P.; Gong, Y.Y. Seasonal and gestation stage associated differences in aflatoxin exposure in pregnant Gambian women. Tropical Medicine and International Health 2014, 19, 348-354.
- Castelino, J.M.; Routledge, M.N.; Wilson, S.; Dunne, D.W.; Mwatha, J.K.; Gachuhi, K.; Wild, C.P.; Gong, Y.Y. Aflatoxin exposure is inversely associated with IGF1 and IGFBP3 levels in vitro and in Kenyan schoolchildren. Molecular Nutrition and Food Research 2015, 59, 574-581.
- Watson, S.; Diedhiou, P.M.; Atehnkeng, J.; Dem, A.; Bandyopadhyay, R.; Srey, C.; Routledge, M.N.; Gong, Y.Y. Seasonal and geographical differences in aflatoxin exposures in Senegal. World Mycotoxin Journal 2015, 8, 525-531.
- Watson, S.; Chen, G.; Sylla, A.; Routledge, M.N.; Gong, Y.Y. Dietary exposure to aflatoxin and micronutrient status among young children from Guinea. Molecular Nutrition and Food Research 2016, 60, 511-518.
- Asiki, G.; Seeley, J.; Srey, C.; Baisley, K.; Lightfoot, T.; Archileo, K.; Agol, D.; Abaasa, A.; Wakeham, K.; Routledge, M.N.; Wild, C.P.; Newton, R.; Gong, Y.Y. A pilot study to evaluate aflatoxin exposure in a rural Ugandan population. Tropical Medicine and International Health 2014, 19, 592-599.
- Routledge, M.N.; Kimanya, M.E.; Shirima, C.P.; Wild, C.P.; Gong, Y.Y. Quantitative correlation of aflatoxin biomarker with dietary intake of aflatoxin in Tanzanian children. Biomarkers 2014, 19, 430-435.
- Leong, Y. H.; Rosama, A.; Latiff, A. A.; Izzah, A. N. Associations of serum aflatoxin B1-lysine adduct level with sociodemographic factors and aflatoxins intake from nuts and related nut products from Malaysia. International Journal of Hygiene and Environmental Health 2012, 215, 368-372.
- Wild, C. P.; Jiang, Y. Z.; Sabbioni, G.; Chapot, B.; Montesano, R. Evaluation of methods for the quantitation of aflatoxin-albumin adducts and their application to human exposure assessment. Cancer Research 1990, 50, 245-251.
- Chen, G.; Gong, Y.Y.; Kimanya, M.E.; Shirima, C.P.; Routledge, M.N. Comparison of urinary aflatoxin M1 and aflatoxin albumin adducts as biomarkers for assessing aflatoxin exposure in Tanzanian children. Biomarkers 2017, 131-136. http://dx.doi.org/10.1080/1354750X.2017.1285960
- Zinedine, A.; Soriano, J. M.; Moltó, J. C.; Manes, J. Review on the toxicity, occurrence, metabolism, detoxification, regulation and intake of zearalenone: an oestrogenic mycotoxin. Food and Chemical Toxicology 2007, 45, 1-18.
- de Andres F.; Zougagh, M.; Castaneda, G.; Rios A. Determination of zearalenone and its metabolites in urine samples by liquid chromatography with electrochemical detection using a carbon nanotube-modified electrode. Journal of Chromatography A 2008, 1212, 54-60.
- Shin, B. S.; Hong, S.; Hwang, S. W.; Kim, H. J.; Lee, J. B.; Yoon, H. S.; Kim, D. J.; Yoo, S. D. Determination of zearalenone by liquid chromatography/tandem mass spectrometry and application to a pharmacokinetic study. Biomedical Chromatography 2009b, 23, 1014–1021.
- Mally, A.; Solfrizzo, M.; Degen, G.H. Biomonitoring of the mycotoxin Zearalenone: current state-of-the art and application to human exposure assessment. Archive of toxicology 2016, 90(6), 1281-1292.
- van Bennekom, E. O.; Brouwer, L.; Laurant, E. H. M.; Hooijerink, H.; Nielen, M. W. F. Confirmatory analysis method for zeranol, its metabolites and related mycotoxins in urine by liquid chromatography-negative ion electrospray tandem mass spectrometry. Analytica Chimica Acta 2002, 473, 151-160.
- Launay, F. M.; Young, P. B.; Sterk, S. S.; Blokland, M. H.; Kennedy, D. G. Confirmatory assay for zeranol, taleranol and the Fusarium spp. toxins in bovine urine using liquid chromatography-tandem mass spectrometry. Food Additives and Contaminants 2004, 21, 52-62.
- Schmidt, K.; Stachel, C.; Gowik, P. Development and in-house validation of an LC-MS/MS method for the determination of stilbens and resorcyclic acid lactones in bovine urine. Analytical and Bioanalytical Chemistry 2008, 391, 1199-1210.
- Warth, B.; Sulyok, M.; Krska, R. LC-MS-based multibiomarker approaches for the assessment of human exposure to mycotoxins. Analytical and Bioanalytical Chemistry 2013a, 405, 5687-5695.
- Warth, B.; Sulyok, M.; Berthiller, F.; Schuhmacher, R.; Krska, R. New insights into the metabolism of the Fusarium mycotoxins deoxynivalenol and zearalenone. Toxicology Letters 2013b, 220, 88-94.
- Shin, B.; Hong, S.; Bulitta, J.; Hwang, S. W.; Kim, H. H.; Lee, J. B.; Yang, S. D.; Kim, J. E.; Yoon, H. S.; Kim, D. J.; Yoo, S. D. Deposition, oral bioavailability and tissue distribution of zearalenone in rats at various dose levels. Journal of Toxicology and Environmental Health Part A 2009a, 72, 1406-1411.
- Gong, Y. Y.; Torres-Sanchez, L.; Lopez-Carrillo, L.; Peng, J. H.; Sutcliffe, A. E.; White, K. L.; Humpf, H. -U.; Turner, P. C.; Wild, C. P. Association between tortilla consumption and human urinary fumonisin B1 levels in a Mexican population. Cancer Epidemiology, Biomarkers and Prevention 2008, 17, 688-694.
- Rheeder, J. P.; Marasas, W. F. O.; Theil, P. G.; Sydenham, E. W.; Shephard, G. S.; Van Schalkwyk, D. J. Fusarium moniliforme and fumonisins in corn in relation to human esophageal cancer in Transkei. Phytopathology 1992, 82(3), 353-357.
- Sun, G.; Wang, S.; Hu, X.; Su, J.; Huang, T.; Yu, J.,Tang, L.; Gao, W.; Wang, J. S. Fumonisin B1 contamination of home-grown corn in high-risk areas for esophageal and liver cancer in China. Food Additives and Contaminants 2007, 24(2), 181-185.
- Missmer, S. A.; Suarez, L.; Felkner, M.; Wang, E.; Merrill Jr, A. H.; Rothman, K. J.; Hendricks, K. A. Exposure to fumonisins and the occurrence of neural tube defects along the Texas-Mexico border. Environmental Health Perspectives 2006, 114(2), 237-241.
- Gelineau‐van Waes, J.; Rainey, M. A.; Maddox, J. R.; Voss, K. A.; Sachs, A. J.; Gardner, N. M.; Wilberding, J. D.; Riley, R. T. Increased sphingoid base‐1‐phosphates and failure of neural tube closure after exposure to fumonisin or FTY720. Birth Defects Research Part A: Clinical and Molecular Teratology 2012, 94(10), 790-803.
- Shepherd, G. S.; van der Westhuizen, L.; Sewram, V. Biomarkers of exposure to fumonisin mycotoxins: a review. Food Additives and Contaminants 2007, 24, 483-489.
- Silva, L. J. G.; Lino, C. M.; Pena, A. Sphinganine-sphingosine ratio in urine from two Portuguese populations as biomarker to fumonisins exposure. Toxicon 2009, 54, 390-398.
- van der Westhuizen, L.; Shepherd, G. S.; Burger, H. M.; Rheeder, J. P.; Gelderblom, W. C. A.; Wild, C. P.; Gong, Y. Y. Fumonisin B1 as urinary biomarker of exposure in a maize intervention study among South African subsistence farmers. Cancer Epidemiology, Biomarkers and Prevention 2011, 20, 483-489.
- Shirima, C.P.; Kimanya, M.E.; Routledge, M.N.; Srey, C.; Kinabo, J.L.; Humpf, H-U.; Wild, C.P.; Gong, Y.Y. A prospective study of growth and biomarkers of exposure to aflatoxin and fumonisin in early childhood in Tanzania. Environment Health Perspectives 2015, 123, 173-178.
- Ahn, J.; Kim, D.; Kim, H.; Jahng, K. -Y. Quantitative determination of mycotoxins in urine by LC-MS/MS. Food Additives and Contaminants Part A 2010, 27, 1674–1682.
- Shephard, G. S.; Burger, H-S.; Gambacorta, L.; Gong, Y. Y.; Krska, R.; Rheeder, J. P.; Solfrizzo, M.; Srey, C.; Sulyok, M.; Visconti, A.; Warth, B.; van der Westhuizen, L. Multiple mycotoxin exposure ddetermined by urinary biomarkers in rural subsistence farmers in the former Transkei, South Africa. Food and Chemical Toxicology 2013, 62, 217-225.
- Solfrizzo, M.; Gambacorta, L.; Warth, B.; White, K.; Srey, C.; Sulyok, M.; Krska, R.; Gong, Y. Y. Comparison of single and multi-analyte methods based on LC-MS/MS for mycotoxin biomarker determination in human urine. World Mycotoxin Journal 2013, 6(4), 355-366.
- Solfrizzo, M.; Gambacorta, L.; Visconti, A. Assessment of multi-mycotoxin exposure in Southern Italy by urinary multi-biomarker determination. Toxins 2014, 6, 523-538.
- Rodríguez-Carrasco, Y.; Moltó, J. C.; Mañes, J., Berrada,H. Development of a GC-MS/MS strategy to determine 15 mycotoxins and metabolites in human urine. Talanta 2014, 128, 125-131.
- Rodríguez-Carrasco, Y.; Moltó, J. C.; Mañes, J.; Berrada,H. Exposure assessment approach through mycotoxin/creatinine ratio evaluation in urine by GC-MS/MS. Food and Chemical Toxicology 2014, 72, 69-75.
- Czeh, A.; Mandy, F.; Feher-Toth, S.; Torok, L.; Mike, Z.; Kosszegi, B.; Lustyik, G. A flow cytometry based competitive fluorescent microsphere immunoassay (CFIA) system for detecting up to six mycotoxins. Journal of Immunological Methods 2012, 384, 71-80.
- Devreese, M.; Baere, S. D.; Backer, P. D.; Croubels, S. Quantitative determination of several toxicological important mycotoxins in pig plasma using multi-mycotoxin and analyte-specific high performance liquid chromatography-tandem mass spectrometric methods. Journal of Chromatography B 2012, 1257, 74-80.
- Ediage, E. N.; Mavungu, J. D. D.; Song, S.; Wu, A.; Peteghem, C. V.; Saeger, S. D. A direct assessment of mycotoxin biomarkers in human urine samples by liquid chromatography tandem mass spectrometry. Analytica Chimica Acta 2012, 741, 58-69.
- Ediage, E. M.; Mavungu, J. D. D.; Song, S.; Sioen, I.; Saeger, S. D. Multimycotoxin analysis in urines to assess infant exposure: A case study in Cameroon. Environment International 2013, 57-58, 50-59.
- Ezekiel, C. N.; Warth, B.; Ogara, I. M.; Abia, W. A.; Ezekiel, V. C.; Atehnkeng, J.; Sulyok, M.; Turner, P. C.; Tayo, G. O.; Krska, R.; Bandyopadyay, R. Mycotoxin exposure in rural residents in Northern Nigeria: A pilot study using multi-urinary biomarkers. Environment International 2014, 66, 138-145.
- Cao, X.; WU, S.; Yue, Y.; Wang, S.; Wang, Y.; Tao, L.; Tian, H.; Xie, J.; Ding, H. A high-throughput method for the simultaneous determination of multiple mycotoxins in human and laboratory animal biological fluids and tissues by PLE and HPLC-MS/MS. Journal of Chromatography B 2013, 942-943, 113-125.
- Song, S.; Ediage, E. N.; Wu, A.; Saeger, S. D. Development and application of salting-out assisted liquid/liquid extraction for multi-mycotoxin biomarkers analysis in pig urine with high performance liquid chromatography/tandem mass spectrometry. Journal of Chromatography A 2013, 1292, 111-120.
- Abia, W. A.; Warth, B.; Sulyok, M.; Krska, R.; Tchana, A.; Njobeh, P. B.; Turner, P. C.; Kousankfack, C.; Eyongetah, M.; Dutton, M.; Moundipa, P. F. Biomonitoring of mycotoxin exposure in Cameroon using urinary multi-biomarker approach. Food and Chemical Toxicology 2013, 62, 927-934.
- Gerding, J.; Cramer, B.; Humpf, H.U. Determination of mycotoxin exposure in Germany using an LC MS/MS multibiomarker approach. Molecular Nutrition and Food Research 2014, 58(12), 2358-2368.
- Gerding, J.; Ali, N.; Schwartzbord, J.; Cramer, B.; Brown, D.L.; Degen, G.H; Humpf, H.U. A comparative study of the human urinary mycotoxin excretion patterns in Bangladesh, Germany, and Haiti using a rapid and sensitive LC-MS/MS approach. Mycotoxin Research 2015, 31(3), 127-136.
Disclaimer/Publisher’s Note
The statements, opinions and data contained in all publications are solely those of the individual author(s) and contributor(s) and not of Dialogic Academic Presses (DAPresses), Dialogic Solutions Ltd and/or the editor(s). Dialogic Solutions Ltd and/or the editor(s) disclaim responsibility for any injury to people or property resulting from any ideas, methods, instructions or products referred to in the content.
How to cite this article
Cite this article
APA style shown. Use “Cite” for MLA, Chicago, IEEE, BibTeX and RIS formats.
Metrics
854
Article views
133
PDF downloads