
Gas Chromatography Method Development and Validation for Separating Non-polar Volatile Hydrocarbons
1 ✉
- 1Department of Chemical Engineering, The University of Manchester, United Kingdom, M13 9PL.
https://doi.org/10.66845/dstem.2026.00004
Cite this article
Related Articles
Measuring Human Mycotoxins Exposure Using Biomarkers - A Review
Ukpai Eze
Dialogic STEM Journal · 2026
ArticleClimate Change Resilience and Adaptation Pathways for Africa’s Agricultural Sector
Francis Bisong, Asuquo Okon, Ekaba Bisong and Jackson Akor
Dialogic STEM Journal · 2026
ArticleDesign, Prototyping and Testing of Mechatronic Spinner for Domain-Based Systems Thinking
Chukwuma Ogbonnaya and Chagary Ranjan
Dialogic STEM Journal · 2026
ArticleDynamic Differential Games of Nuclear Proliferation and Preemption under Uncertainty
Innocent Adinebo Katule and Akindele Michael Okedoye
Dialogic STEM Journal · 2026
Contents
Abstract
To be effective, chromatography methodology requires specific tailoring to match the properties of the mixture being separated. In this study, an alkane standard mixture of hydrocarbons (nC8 – nC40) was used to develop the method to identify the hydrocarbons present in an oil contaminated environment. To do this, the boiling point of the mixture, the column temperature, the inlet temperature and the flow rate of the chromatography equipment were varied until separations between the components were observed. To validate this method, pure compounds of hexadecane, nC16 (0.765 mg) and undecane, nC11 (0.733 mg) were used. Interestingly, the elution time of nC16 was in accordance with that obtained for nC16 from the standard mixture of alkane. It was observed that the elution time of nC11 was between the elusion times for nC10 and nC12. The significance of these findings is that the proposed method can be used to identify a wide range of hydrocarbons in a mixture, which can be applied in environmental remediation of contaminated soils as hydrocarbons can be clearly and distinctively separated and identified.
Keywords
Full text
Reading view1. Introduction
Environmental analysts rely on chromatography to identify and quantify the concentration of petroleum contaminants in the soil. Several analytical techniques are available to characterise and measure the types of hydrocarbon concentration in an oil field or in a laboratory. Some techniques include standard gas chromatography with flame ionisation (EPA Method 8015B) [1–6], gravimetric determination (EPA Method 1664A) [7,8], infrared spectrophotometry (EPA methods 418.1, 8440, and 9071B) [9,10], turbidimetry screening (EPA Methods 2004c) [11], gas chromatography with mass spectrometric detection (GC/MS) (EPA Methods 8270 and 625), immunoassay (EPA Methods 4030 and 4035), spectroscopy and gas chromatography method [12]. Adeniji [13] provided a summary of these techniques.
Gas chromatography (GCs) enables the quantitative analysis of a wide range of volatile and semi-volatile hydrocarbons (n-alkanes from C10 to C40 [20], boiling range from 175 °C to 525 °C) [6] [29]. However, GCs detection limits are method and matrix-dependent [8]. The United States Environmental Protection Agency (USEPA) and International Standards Organization (ISO) prefer GC methods and detectors for compliance monitoring of total petroleum hydrocarbon (TPH) content because of their high selectivity, sensitivity, and resolution over a wide range of hydrocarbon concentrations [14–16]. These regulatory agencies have set 50 mg/kg of soil as the baseline standards for TPH measurement. This is the global parameter that is used to establish target soil clean-up levels after an oil spillage event [17–19]. Moreso, ISO 16703 (ISO, 2004) is an internationally accepted method to obtain TPH concentrations from C10 to C40 [20]. For the above reasons, most countries [8] employ TPH-based criteria for site monitoring and clean-up because it enhances the ability to confirm the extent of pollution in a contaminated soil, compared with the regulatory baseline.
Various detectors can be used with the GC systems, and a number of researchers have studied such methods [21–23]. Flame ionisation detector, which has a signal proportional to the concentration of the analyte in the carrier gas, is often used for environmental analysis [24]. Flame ionization detectors are reliable and sensitive to molecules that are ionized in a hydrogen–air flame, including most carbon-containing compounds such hydrocarbons [25]. Petroleum products are classified based on the volatility of the analyte, boiling point range of the components, and the families of chemical compounds present in the sample [26]. Detection of petroleum hydrocarbons in soil can be done using gas chromatography based on their configuration.
However, some on-site applications are not suitable because they are time-consuming, bulky and require high energy consumption. Two types of field GCs have been developed for measuring the release of petroleum concentration in oil spill contaminated sites in the field [27,28]. These GCs are lightweight and can be easily carried in the field, offering results within 10mins of analysis time. Portable GCs tend to use photoionization detectors (PIDs), which are most sensitive to aromatic hydrocarbons with lower ionization energies, thus, unable to detect light aliphatic compounds [29]. PIDs use an ultraviolet (UV) light source to break down VOCs in the air into positive and negative ions. The PID then detects or measures the change of the ionized gas, with the charge being a function of the concentration of VOCs in the air [30]. Due to GCs components configuration, the GC equipment requires a stable environment to function; the energy supplies of Portable GCs needed for rapid temperature ramping are limited and hence are heated isothermally to obtain consistent and comparable results. William and Fisher [27] reported using this device for screening the study of VOCs soil gas, soil, and water samples.
Transportable GCs are mobile laboratory units, but unlike portable GCs, they require external power and gas supplies and are hence capable of providing better constituent separation and, therefore, more accurate identification and quantitation of the hydrocarbon constituents. The possibility of greater constituent separation is possible with this device because it uses longer capillary columns (30 to 60 m) versus 10 to 15m used in portable GCs. In addition, rapid temperature ramping of transportable GC columns and consistent temperature control of the entire GC system provide better separation and reproducibility than the isothermal heating of portable GCs. Many transportable GCs are certified to carry out U.S.EPA, SW-846 methods and as a result can provide data in the field that are equivalent to the data obtained in Laboratory [29]. Both flame ionization detector and photoionization detectors can be used as detectors with transportable GCs. However, environmental control is needed, which could vary from inside a truck, under shade, or a mobile laboratory for the gas cylinders and energy supplies.
The evolution in design and performance of portable GC units makes it possible to confirm the identity of environmental contaminants and quantifies their concentrations, hence enabling these systems to meet the advancing needs of the field detection and measurement rapidly and reliably. Field GCs provide quantitative, constituent specific analysis of volatile and semi-volatile hydrocarbons in part per billion (ppb) ranges for soil, soil-gas, and water with a lower detection limit of between 1 to 10 ppb, depending on the method and equipment employed [29]. The technology has been deployed for various commercial applications. For example, Defiant Technologies [28] invented a handheld microsystem (FROG-4000TM) capable of detecting BTEX and other volatile organic compounds (VOCs) in the soil in situ.
Chromatography methodology requires specific tailoring to the process it will be applied to, consequently, hence the purpose of developing the current GC methodology was to separate and analyse petroleum hydrocarbon in an oil-contaminated field. In particular, the overall aim of this research was to develop a GC methodology for detecting and quantifying the different range of hydrocarbon in an oil spill sample matrix in Niger Delta area in Nigeria. To achieve this aim, the following objectives were outline for study.
- Identify the column with the polarity suitable for analysing non-polar compounds.
- Standardise the GC equipment using alkane standard mixture ranging from C8 – C40.
- Optimise the equipment using the physical properties of the target compounds.
- Validate the accuracy and precision of the gas chromatography method.
- Identify and quantify the concentration range of the field soil samples using the GC-FID developed method.
- Assess the percolation and concentration levels of the pollutants within the sampling area and comparing them at different depths.
The major contribution of this research is that the validated methodology can be used to detect and quantify hydrocarbons in oilfields across the globe. This will enhance the response time for remediation and clean up of oil spillages. The outline of the paper is organised as follows. Next, research methodology including materials, instrumentation, method development and optimisation and method validation are presented. Section 3 presents the results and discussions. Section 4 presents the conclusions of the study.
2. Research Methodology
GC describes all chromatographic methods in which the mobile phase is a gas and involves either liquid or a solid stationary phase retained on a column wall [31]. During GC analysis, the sample of interest is injected into the system [32], however, the sample had to be vaporized if not already in the gaseous phase. The carrier gas is usually an inert gas such as helium, which transfers the sample's components through the GC column. During transfer of the sample through the GC, the column temperature is increased at a specified rate based on the properties of the components to be separated or in an isothermal mode. Each of the chemical elements in the sample travels through the GC column partitioning between the mobile and stationary phases. The partitioning behaviour is highly dependent on the characteristic of the analyte, the GC settings and conditions, and many factors including the flow rate of the carrier gas, and the analytes boiling point. Analytes with lower boiling points are expected to travel more quickly through the column than those with higher boiling points. The time taken for a chemical to pass through the GC from injection to detector is known as its retention time and is used for comparative identification. The retention time of the GC eluted peak is set in units of seconds or minutes and are used as the primary point of comparison with retention-time data from a standard sample. The next section describes the specific tailoring that was implemented in this extant study.
2.1 Materials and Instrumentation
Hexane (98%), undecane (99%), hexadecane (99%) and dichloromethane (99%), 50mg/L of standard alkane mixture, nC8–nC40 (all even) were purchased from Sigma Aldrich. Cellulose Extraction thimbles (Whatman) with single thickness 26 mm x 60 mm were purchased from GE Healthcare.
The important parameter that dictates effective sample separation is the choice of the column. The selection is based on the principle that "like dissolves like". This implies that a polar column will be best for the polar compounds whereas non-polar columns is best for non-polar compounds. Since only elements of C and H were present, hydrocarbons are nonpolar, ZB-1 column was identified and employed for the separation. The ZB-1 column was selected because it was amongst the lowest polarity columns available commercially with 100% dimethyl-polysiloxane stationary phase suitable to analyse wide range of non-polar compounds including petroleum hydrocarbons. It has a wide operating temperature range (-60 ºC to 370 ºC) making it suitable for analysis of wide range of compounds including those with high boiling points. ZB-1 has low bleed level, which makes it efficient and suitable for use on GC detector for comparative studies.
The column was purchased with a Guard Column Kit (Deactivated Tubing 5 m long) which protected the GC column from contamination especially when the sample contains non-volatiles components. The guard column helps to extend the lifetime of the column and gives better efficiency and more reproducible results. This has been tested by individual quality controls (QC) according to manufacturer and was confirmed that it ensures optimal results upon installation and suitable for wide range of GC columns.
2.2 GC Method development
An alkane standard mixture of hydrocarbons (nC8 – nC40) was used to develop a method that can identify and quantify the hydrocarbons present in the environmental samples. Optimisation of the physical properties of the mixture (such as volatility, affinity), the column temperature, the inlet temperature and temperature programming, split/splitless ratio injection, the size and injection technique, the flow rate and the speed were varied until a clear separation between component peaks were achieved.
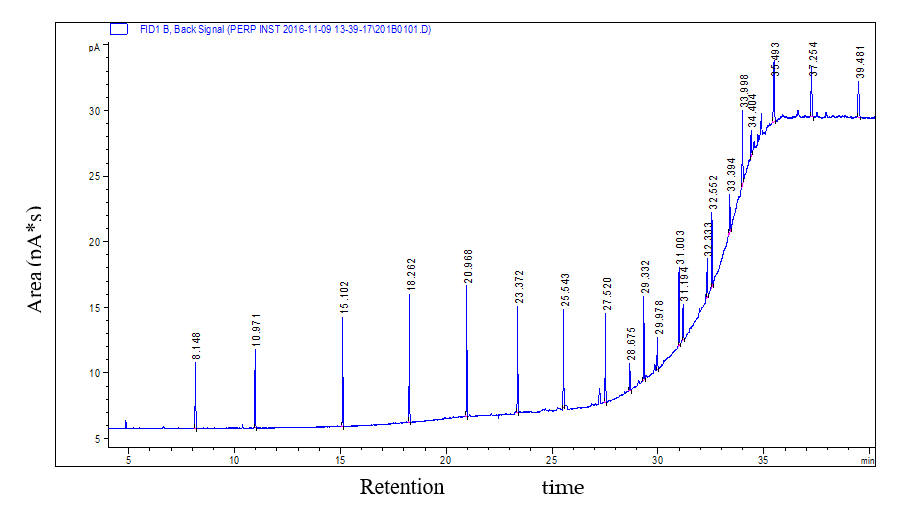
The method development started with column conditioning which was done by running a blank (i.e., no sample injection) on the equipment isothermally at 300 ºC for 60 min until the baseline was achieved. This process was to ensure that the column is purged of any impurity trapped during manufacturing. Once achieved, the initial temperature was reset to 50 ºC based on the boiling point value of the solvent (hexane – 67 ºC), and a hold-time for 5 minutes was applied. The separation was allowed to run for 10 mins before increasing the speed at which the mobile gas (helium) moves the analytes through the column with a total run time of 43 minutes. The sample injection mode was split into 100 mL:1 mL such that the entire injected amount of sample does not go into the column. This means that some of the sample injected into the injector by the sample syringe will be vaporized and escape through the split vent. However, the separation using split condition was not favourable as the separation could not maintain a stable baseline.
2.3 GC Method optimisation
To achieve optimal method for separating the hydrocarbons, there was a need to achieve stability and high peak counts in the ramping setting. This was necessitated by an observed instability and low peak counts after the initial parameter settings for the method development. Following result obtained from the initial parameter setting, the instrumental parameters were further optimized. Due to the range of compounds of interest and low volatility, the inlet temperature was raised (from 250 ºC to 330 ºC) to ensure sufficient sample volatilisation. The initial temperature was increased (from 50 ºC to 70 ºC) since the mixture comprises mostly of analytes with high boiling points. This was followed by an increase in the speed at which the compound moves in the column. The initial velocity was at 8.42 cm/s but was increased to 15.42 cm/s which automatically increased the flow rate from 0.9 mL/min to 1.99 mL/min. The injection was switched from split to splitless, this is called the splitless mode and it is used for trace analysis (when the sample contains very small amounts of analyte). Operating in the splitless mode is the most sensitive a method can be because in this mode all the analyte mass in 1 µL injection sample vaporized in the injector goes onto the column. The interaction time between the sample and the mobile phase in the column was increased (from 5 mins to 20 mins hold time) to allow more separation and elution, resulting to an increase in the overall run time.
2.4 Method of data collection
The Agilent Chemstation was used for data collection and manipulation. The injector was set to purge twice in pure hexane to avoid cross contamination after each injection. The GC initial velocity was 15.42 cm s-1 and the initial oven temperature was held isothermally for 5 min at 50 °C, ramped to 70 °C for 5 min, then programmed to sequentially step from 70 °C to 330 °C at a heating rate of 8°C/min and held isothermally for 20 mins. The detector (FID) was at the flow rate of 1.99 ml/min at 330 ºC. Table 1 shows the parameters for GC-FID instrument condition and their value.
| Parameter | Value |
|---|---|
| Inlet | Splitless at 300 °C |
| Injection volume | 1 uL |
| Initial velocity | 15.42 cm/s |
| Constant column flow | 1.99 mL/min helium |
| Column temperature program | 70 °C for 10 minutes/ Hold – 10mins; 250 °C/min to 330 °C at 8°C/minute; 330 °C for 20 minutes |
| Detector | Flame ionization at 330 °C |
2.5 Method validation
To assess the reliability of the developed method suitable for identifying petroleum hydrocarbons ranging from nC8 to nC40, the linearity, precision and accuracy were investigated. The linearity of the method was investigated at ten concentrations between 0.0125 µg/µl and 0.125 µg/µl. Two pure compounds of same amount (1 µl) of hexadecane, nC16 and undecane, nC11 were injected into the GC and separated by the developed method. The elution times of hexadecane and undecane hydrocarbons are consistent in accordance to the results obtained from the standard alkane mixture range of nC8 to nC40, all even.
2.6 Application of developed method for field sample analysis
After the environmental sample was extracted using Soxhlet and Soxtec extraction techniques as described in the above previous sections. The extracts from the environmental samples at different depths were analysed using the validated method, Gas Chromatography coupled with flame ionisation detector (GC-FID). To ensure reliable identification of the unknown hydrocarbons in the environmental sample, the Kovats system was used. The Kovats system is one of the most widely accepted methods of reporting data recommended for use in the standardization of retention data [33]. The experiment was conducted under linear temperature programming and the unknown hydrocarbons were identified.
3. Results and Discussion
Before calibration and analysis, a suitability test was performed by injecting standards comprising a heptane solution containing 50 mg/L of even numbered alkanes from C8H18 to C40H82 into the GC-FID. The GC system performance was optimised for resolution, recovery and response by parameter variation based on the physical properties of the mixture (volatility, affinity and the strength of interaction and partition coefficients), the column temperature, the inlet temperature and temperature programming, split/split less ratio injection, the size and injection technique, the flow rate until a clear separation between component peaks were observed. A unique combination of these parameters ensures a good interaction between the stationary and mobile phase and promotes good separation of the standard analytical mixture. The conditions used to achieve the optimum method of separation in this work and the corresponding chromatogram [34] obtained for the sample mixture are further discussed henceforth.
3.1 Results from method development and optimization
Initially, the settings for method development were set at 50 ºC based on the boiling point value of the solvent (hexane – 67 ºC), and a hold-time for 5 minutes, and the separation was allowed for 10 mins before increasing the speed of the mobile gas. From Figure 1, there is a clear instability and low peak counts which could be attributed to the temperature ramping setting; thus, suggesting that the entire injected amount of sample was not eluting and requires an extended time.
Optimisation was implemented to ensure that the total number of peaks that elute corresponds to the number of hydrocarbons present in the analytical standard mixture. A unique combination of the parameters was used to realise a good interaction between the stationary and mobile phases thereby facilitating separation of the standard analytical mixture. The chromatogram showed that the GC-FID can predict the relative volatilities of the hydrocarbon's components in the alkane mixture accurately and that the area of the peak is proportional to the concentration of the corresponding compound in the sample.
Positions of the compounds in the column and the retention time correlated with their diffusion interaction parameters which is driven by thermodynamics and possibly other retention interactions process. However, the peak band widths of the separated analytes are determined by diffusion-driven and adsorption/desorption-driven kinetics of analyte mass transfer within (a) the mobile phase, (b) within stationary phase and (c) between the mobile and stationary phase. The carrier gas operating mode was set to operate at constant flow to ensure that it flows at the same linear velocity during temperature programming to avoid peak broadening.
| Oven Temp | Rate ºC | Value ºC | Hold time(min) | Run time (min) |
|---|---|---|---|---|
| Initial | 50 | 5 | 10 | |
| ramp | 6°C/min | 325 | 5 | 53 |
For optimum separation, it is important that the total number of peaks eluted corresponds to the number of hydrocarbons present in the analytical mixture. Figure 2 shows that the spectrum of the hydrocarbon peaks were well separated and each n-alkane in the mixture is baseline resolved with a little drift after time 40 mins possibly due to column saturation. The response of octane (C8) was measured at 5.282 mins and tetracontane (C40) at 53.683. These values indicate excellent system performance with respect to boiling point discrimation [35].
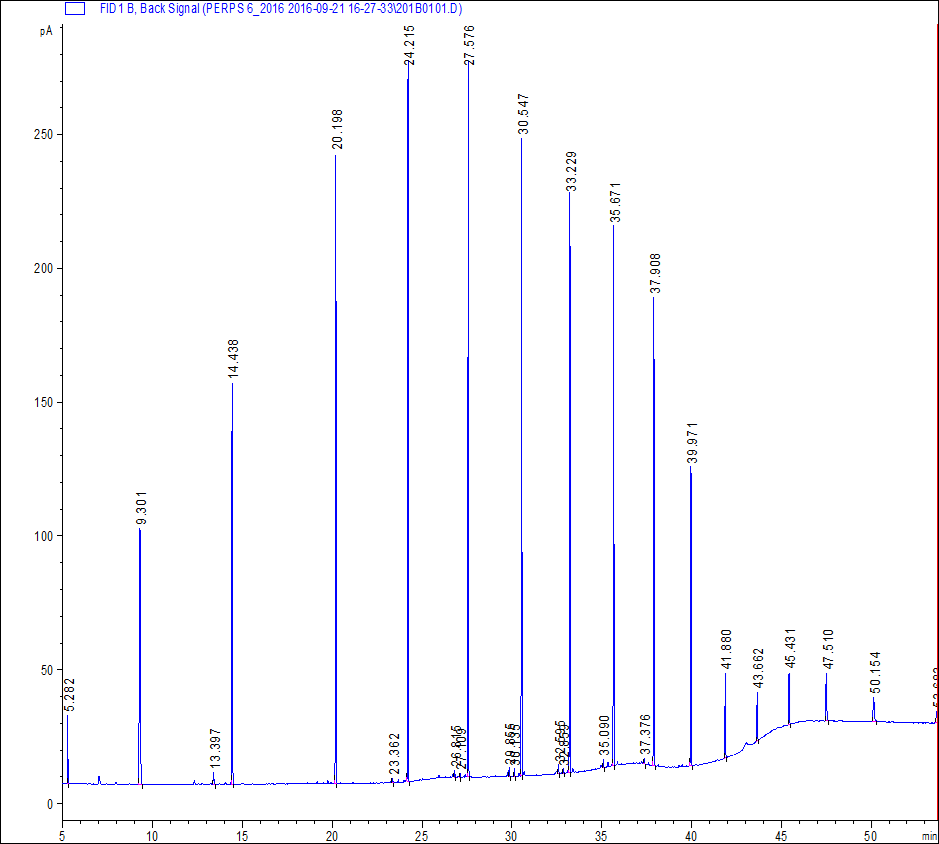
Figure 2. Separation method development using Standardised alkanes with all 17 compounds eluted (C8 –C40) using ZB-1 column with 100% dimethyl-polysiloxane stationary phase. Operating conditions: inlet T = 300°C, Flow = 1.99mL/min helium, Average velocity =15.42 cm/s, detector T = 330°C, volume injection = 1µl (splitless).
3.2 Results on the validation of the method
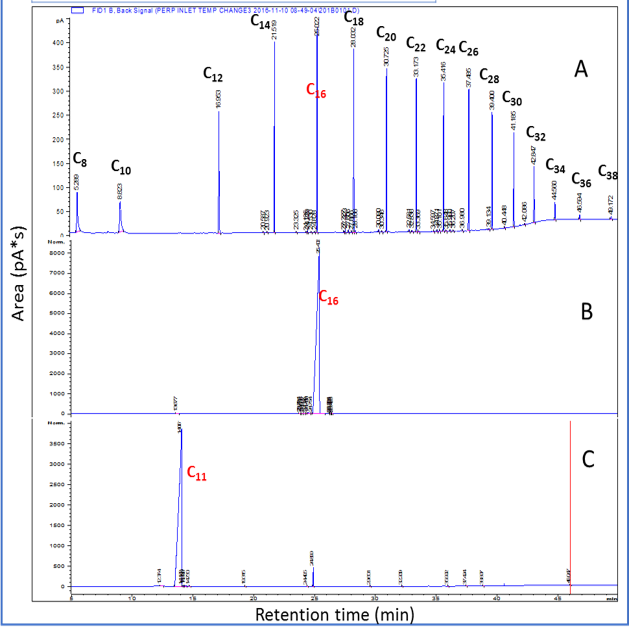
Following system calibration, method validation is an essential way to confirm that the performance of the developed method is consistent for the application requirements and can be taken with confidence [36]. Accordingly, the method was validated by injecting 1 µL [37] of pure compounds of hexadecane, nC16 (0.765 mg) and undecane, nC11 (0.733 mg) into the GC and separated using the developed method. Results from the chromatographic quantification, Figure 3, show that these compounds were detected, identified and eluted accordingly. The elution time of nC16 was in accordance with that obtained for nC16 from the standard alkane mixture. For the nC11 (not present in the standard alkane mixture), the elution time was between nC10 and nC12 carbon numbers as previously reported in literature [51]. This validation study confirms the capability of the developed method in identifying a wide range of hydrocarbons from a sample mixture. The retention time for undecane (not present in the standard alkane mixture) was 14.061 which is between nC10 (8.823 mins) and nC12 (16.953 mins) and this is consistent with previously a reported study [51]. The achieved outcomes showed that the separation GC/FID method developed is appropriate for the determination and quantification of wide range of hydrocarbons from a sample mixture even at very low concentrations.
From Figure 3, the retention time, (tR,) for hexadecane was 25.022 corresponding to 25.403 (stardard equivalent).
| Compounds | Chromatogram | Retention time (min) |
|---|---|---|
| Alkane Standard Mix | A | 25.022 (C16) |
| Pure Hexadecane | B | 25.403 (C16) |
| Pure Undecane | C | 14.061 (C11) |
3.3 Further validation: Spiked uncontaminated soils
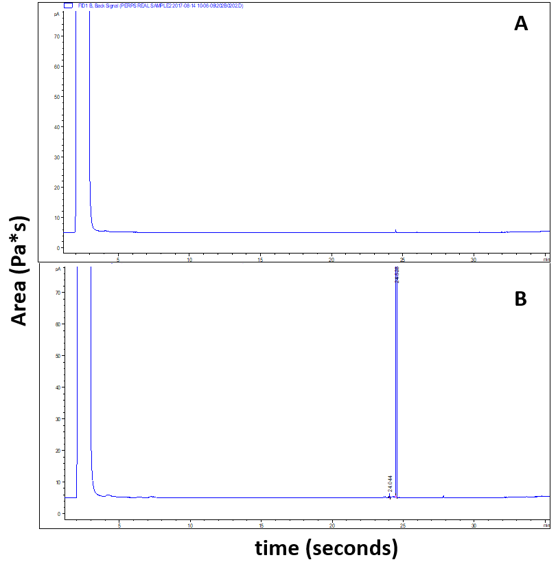
Clean air-dried soils were spiked with the internal standard (nC16). The soils were mixed thoroughly to ensure uniformity and were stored at 4 °C until extraction using Soxhlet method. After extraction, 1 µl of the extract was taken and analysed using the GC-FID developed method. Reference standards and calibration mixtures were used for qualitative and quantitative analyses, instrument calibration and validation. Figure 4 depicts the result from further method validation. The chromatogram shows that nC16 eluted at retention time value of 24.556 min which falls close to the time range of the calibration and standard alkane retention values for nC16.
3.4 Calibration and corelation analysis of compounds
To be confident in the accuracy of the result and minimise any measurement uncertainty, calibration plots of the peak area of targeted compounds of interest (nC8 – nC40) against the concentration of the alkane standard compounds was constructed and their linearity investigated. This was done periodically to ensure that errors associated with the measurements are in the acceptable range. The linear range, slope, and correlation coefficient (R2) of these compounds were studied. Outliers were also observed at end points and at point 2 in nC40, these errors are probably due to column overload and sample introduction errors. The method quality was assured through reproducible calibration and testing of the extraction and GC systems.
In order to obtain the concentration of the hydrocarbons in the soil sample, the analytical range of hydrocarbons were calibrated and the average corresponding peak values of the samples correlated. From the calibration plot in Figure 5 (a) and (b), the slope was determined where m is the measure for the sensitivity of the procedure such that the steeper the slope, the more sensitive the procedure is (i.e. the stronger the instrument response on the y axis to a concentration change on x).
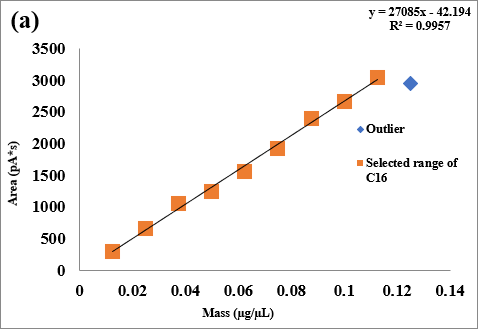
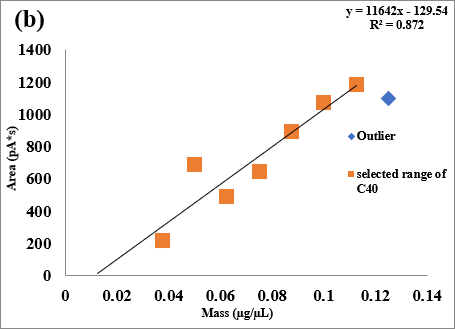
The R2 recorded 0.99 for the hydrocarbon band (C8-C38). The correlation coefficient of 0.99 indicates a good linear correlation across the calibration range except for C40 (0.88). This variation can be attributed to the saturation of the column at that point with high volume injection, particularly as much higher molecular weight compounds were injected. A calibration repeatability test was done by measuring the detector response of three (3) sequential injections of the calibration standard and the measured relative standard deviation (RSD) % was calculated at 95% confidence level.
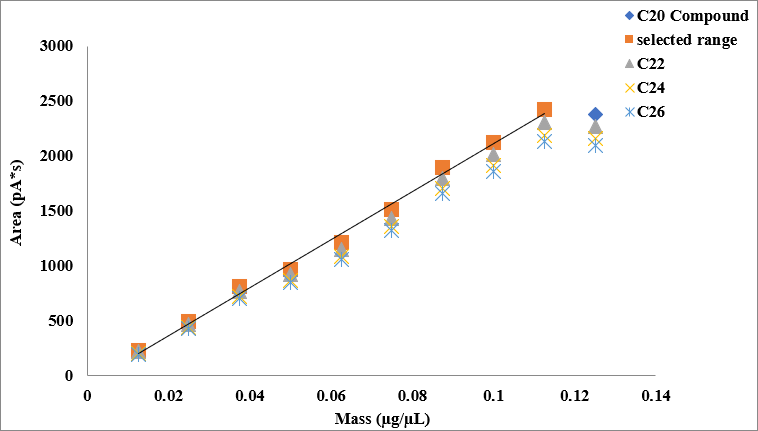
As depicted in Figure 6, there exists high correlations in the sensitivity response between hydrocarbon compounds in the range of nC20 - nC26 in the standard mixture. This correlation can be attributed to the homologous characteristics of the alkanes and can be useful when designing a hydrocarbon fractionation approach model. Additionally, the correlation also shows the possibility of applying these characteristics to develop arrays of chemiresistor sensors for the detection of petroleum hydrocarbons with a similar property response. The equations of the calibration curves obtained using the total petroleum hydrocarbon (TPH) standard were used to analyse, calculate, and correlate the predicted concentrations in the field samples measured using the GC-FID.
Furthermore, to study the hydrocarbon response to the instrumental stationary phase, the sensitivity (i.e. the level of interaction) to hydrocarbon analytes was calculated using the calibration results. Figure 7 shows the relationship between hydrocarbons and their respective sensitive responses. As observed, nC16 with an area value of 27085 has the highest response (sensitivity) to the FID detector compared to nC40 with an area value of 11642. The entire spectrum shows an increment as the carbon number increases from nC8 to nC16 and a decrease from nC18 to nC40, however, with significant decrease in nC40. This is an indication that even though there exists a linear correlation trend between the peak areas and the carbon numbers, the sensitivities of the analytes to the stationary phase are different and do not follow same pattern.
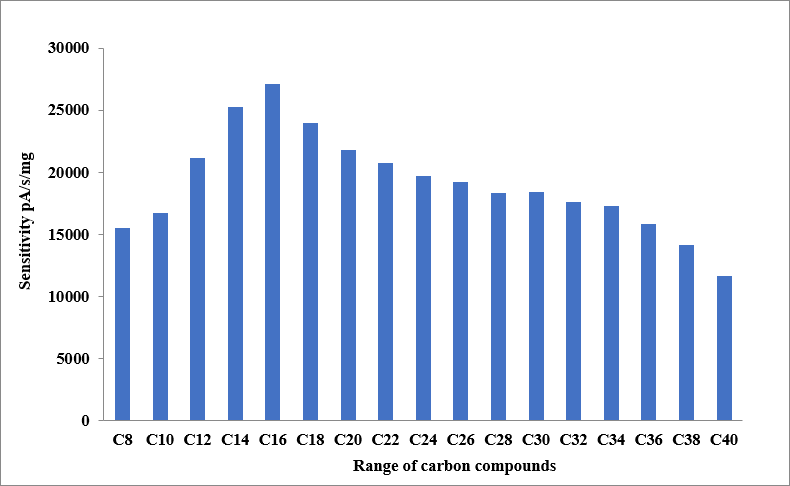
The sensitivity variation could be due to a molecular and structural difference in the interaction between the GC stationary phase and the detected compounds. Although there is limited literature to explain this, on a comparative basis however, the trend shown herein is similar to the data reported by Summers et al. [38]. Thus, the interactions between the n-alkanes and the stationary phase increase with increasing chain length of the alkanes and decreases as the molecular weight decreases. This further suggests that the GC separation and elution order does not primarily depend on the boiling point alone but also on the level of interaction between the analyte and the column stationary phase [39]. When the level of interaction is favourable due to compatibilities as a result of the strength of intermolecular interactions, the analytes have longer elution times. On the other hand, when the level of interactions is unfavourable due to analyte molecule-stationary phase incompatibilities, then the intermolecular interactions are reduced leading to lower elution times. Therefore, the properties of the stationary phase and the movement of the hydrocarbon contributes to the effective or ineffective analyte-stationary phase interactions which in turn influences the peak separation and the time of elution.
3.5 Environmental sample qualitative analysis using Kovats retention indices
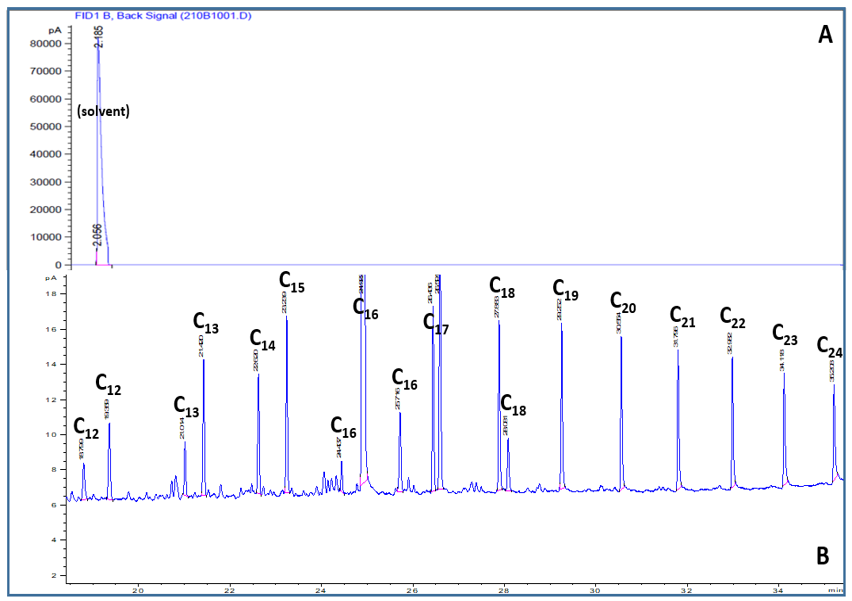
In order to identify the unknown hydrocarbons in the field soil sample, the Kovats system was used. Kovats system is one of the most widely accepted methods of reporting data recommended for use in the standardization of retention data [33] because the experiment is conducted under linear temperature programming. Herein, the experiment was conducted under linear temperature programming, hence the applicability. It is assumed that an approximate linear relationship exists between the n-carbon number and the retention data of unknown compounds of interest, which makes identification uncomplicated. The retention times were determined experimentally for each compound identified in the field sample matrix, and the unknown hydrocarbons were identified using the Kovats index equation as shown in Eq 1. Figure 8 shows the results of the identified hydrocarbons.
I = 100 × [n + (N − n) × (tr(unknown) − tr(n)) / (tr(N) − tr(n))] (1)
Where:
I = Kovats retention index
n = the number of carbon atoms in the smaller n-alkane
N = the number of carbon atoms in the larger n-alkane
tr = the retention index
The chromatogram shows the GC-FID chromatograms for TPH analysis of the two representative samples (uncontaminated vs contaminated soil samples). The differences of chromatograms between them can be readily identified with hydrocarbon eluted form the control sample result in comparison to the contaminated sample result. Also, it is assumed that an approximate linear relationship exists between n-carbon number and the retention of unknown compounds of interest which makes identification uncomplicated. The retention times were determined experimentally for each compound in the field sample mixture, and the unknowns hydrocarbon in the environmental samples were are highlighted B against the control soil sample A collected from an uncontaminated site.
4. Conclusions
In this study, an alkane standard mixture of hydrocarbons (nC8 – nC40) was used to develop the method that could identify the hydrocarbons present in an oil contaminated environment. The boiling point of the mixture, the column temperature, the inlet temperature and the flow rate of the chromatography equipment were varied until separations between the components were observed. The GC method was validated using pure compounds of hexadecane, nC16 (0.765 mg) and undecane, nC11 (0.733 mg). The results show that the elution time of nC16 was in accordance with that obtained for nC16 from the alkane standard mixture. Furthermore, the elution time of nC11 was between the elusion times for nC10 and nC12. The proposed specific tailoring of the method to the properties of the mixture of hydrocarbons proved effective. The significance of these findings is that the proposed method can be used to identify a wide range of hydrocarbons in a mixture, which can be applied in environmental remediation of contaminated soils.
Supplementary Materials: NA
Author Contributions: Conceptualization, PE.; methodology, PE.; software, PE.; validation, PE and PE; formal analysis, PE.; investigation, PE.; resources, PE.; data curation, PE.; writing—original draft preparation, PE.; writing—review and editing, PE.; visualization, PE; supervision. NA; project administration, PE.; funding acquisition, PE.
Funding: The Research was funded by The Schlumberger Faculty for the Future Fellowship. Data Availability Statement: NA
Acknowledgments: I acknowledge the immense support of my PhD supervisor Prof K. Persaud. Conflicts of Interest: The authors declare no conflicts of interest.
References
- American Petroleum Institute (API) Methods for Determination of Petroleum Hydrocarbons in Soil. American Petroleum Institute 1992.
- U.S. Environmental Protection Agency. Method 8015: Nonhalogenated Organics Using GC/FID. USEPA, Washington, DC. 2003.
- American Society for Testing and Materials American Society for Testing and Materials (ASTM) Comparison of Waterborne Petroleum Oils by Infrared Spectroscopy (D3414). In Annual book of ASTM standards. Philadelphia, PA, USA: American Society for Testing and Materials 1994.
- United States Environmental Protection Agency (US EPA). Field Analytical and Site Characterization Technologies Summary of Applications. 1997.
- Miclean, M.; Levei, E.; Gog, A.; Ferenczi, L.; Majdik, C.; Puia C.; Roman, C. Determination of Total Petroleum Hydrocarbons in Contaminated Soil by FTIR and GC-FID Methods. 2010, 55, 83–91.
- ISO 16703 Determination of Content of Hydrocarbon in the Range C10 to C40 by Gas Chromatography, International Organization for Standardization, Geneva, Switzerland. Soil quality 2004.
- Mario Villalobos; Ana Paulina Avila-Forcada; Margarita Eugenia Gutierrez-Ruiz An Improved Gravimetric Method to Determine Total Petroleum Hydrocarbons in Contaminated Soils. Water Air Soil Pollution 2008, 194, 151–161, doi:DOI 10.1007/s11270-008-9704-1.
- Potter, D.L.; Simmons, K.E. Analysis of Petroleum Hydrocarbons in Environmental Media; 1998; Vol. 1; ISBN 1884940145.
- USEPA Method 8440 Total Recoverable Petroleum Hydrocarbons by Infrared Spectrophotometry. 1999.
- Robert W. Current, David C. Tilotta Determination of Total Petroleum Hydrocarbons in Soil by On-Line Supercritical Fluid Extraction-Infrared Spectroscopy Using a Fiber Optic Transmission Cell and a Simple Filter Spectrometer. Journal of Chromatography A 1997, 785, 269–277, doi:10.1016/s0021-9673(97)00466-4.
- United States Environmental Protection Agency (US EPA) METHOD 9074: Turbidimetric Screening Method for Total Recoverable Petroleum Hydrocarbons in Soil; 2007;
- Dumitran, C.; Ion, O.; Florinel, D. Spectroscopy and Gas Chromatographic Measurements of TPH in Soil Samples Contaminated with Crude Oil. Revista de Chimie 2009, 60, 1335–1337.
- Adeniji, A.O.; Okoh, O.O.; Okoh, A.I. Analytical Methods for the Determination of the Distribution of Total Petroleum Hydrocarbons in the Water and Sediment of Aquatic Systems: A Review. Journal of Chemistry 2017, 2017, doi:10.1155/2017/5178937.
- Santos, F.J.; Galceran, M.T. The Application of Gas Chromatography to Environmental Analysis. 2002, 21, 9–10.
- Helcom Draft International Standard ISO/DIS 13877 - Guidelines for the Determination of Polycyclic Aromatic Hydrocarbons (PAH) in Sediment; 1995;
- Skoog, D.A.; West, D.M.; Holler, F.J.; Crouch, S.R. Fundamentals of Analytical Chemistry; Douglas A. Skoog, Ed.; illustrate.; 2004; Vol. 8th Ed; ISBN 0030355230, 9780030355233.
- J. R. Carlos Royal Decree 9/2005 of 14 January Which Establishes a List of Potentially Soil Contaminating Activities and Criteria and Standards for Declaring That Sites Are Contaminated Soil. Ministry of the Presidency 2005, 15, 1833–1843.
- Weisman, W. Analysis of Petroleum Hydrocarbons in Environmental Media. Total Petroleum Hydrocarbon Criteria Working Group (TPHCWG) Series, 1.; Amherst Scientific Publishers, Amherst, Massachusetts, United States of America, 1998; Vol. 1;.
- VROM (Dutch Ministry of Housing Spatial Planning and the Environment) Soil Remediation Circular 2009. Staatscourant 3 April 2012, Nr. 6563. Ministry of Housing, Spatial Planning and the Environment, The Hague 2012.
- Rosano-Hernández M.C., Ramírez-Saad, H.; Fernández-Linares, L. Petroleum Influenced Beach Sediments of the Campeche Bank, Mexico: Diversity and Bacterial Community Structure Assessment. J. Environ. Manage. (Supp) 2012, S325–S331.
- D.J. David Gas Chromatography Detectors. Wiley, New York, NY, 1974.
- J. Sevcik Detectors in Gas Chromutography. Elsevier, Amsterdam, NL, 1976.
- Gordon M.H. Principles of Gas Chromatography. In: Gordon M.H. (Eds) Principles and Applications of Gas Chromatography in Food Analysis. Ellis Horwood Series in Food Science and Technology; Springer, Boston, MA, 1990; ISBN 978-1-4613-0681-8.
- Guiochon, G.; Guillemin, C.L. Chapter 10 Methodology Detectors for Gas Chromatography. In Journal of Chromatography Library; Elsevier, 1988; pp. 393–480 ISBN 0310-4770.
- Hinshaw, J. V. The Flame Ionization Detector. LCGC North America 2005, 23, 1262–1272.
- E. Stauffer; Dolan, J.A.; Newman, R. "Flammable and Combustible Liquids". In: Fire Debris Analysis. In Amsterdam, the Netherlands: Elsevier, Inc.,; 2008; p. Chapter 7, Pp 199-234.
- Williams, S.D.; Farmer, J.J. Volatile Organic Compound Data from Three Karst Springs in Middle Tennessee: U.S. Geological Survey Open-File Report. U.S. Geological Survey Open-File Report 2003, 69.
- Defiant Technology Inc Gas Chromatography System for VOC Analysis in Water, Air, and Soil. 2013.
- Robert Hitzig (U.S. EPA); Roy Chaudet (Logistics Management Institute); Murray Emarson (Emarson Fowler and Watson Inc) Expedited Site Assessment Tools for Underground Storage Tank Sites: A Guide for Regulators. U. S. Environmental Protection Agency 1997.
- TSI Incorporated Photo-Ionization Detection (PID) Technology Application Note TSI-147. Brochure 2013, 3.
- K. Robards; Haddad, P.R.; Jackson, P.E. Principles and Practice of Modern Chromatographic Methods; Academic Press Limited: London, UK, 1994;
- Leary, P.E.; Kammrath, B.W.; Lattman, K.J.; Beals, G.L. Deploying Portable Gas Chromatography–Mass Spectrometry (GC-MS) to Military Users for the Identification of Toxic Chemical Agents in Theater. Applied Spectroscopy 2019, 73, 841–858, doi:10.1177/0003702819849499.
- Hayes, P.C.; Pitzer, E.W. KOVATS Indices as a Tool in Characterizing Hydrocarbon Fuels in Tempertaure Programmed Glass Capilllary Gas Chromatography. Aero Propulsion Laboratory 1981, 87.
- Middleditch, B.S.; Basile, B. Deuteriated Analogs as Internal Standards for the Quantitation of Environmental Alkanes by Gas Chromatography. Analytical Letters 1976, 9, 1031–1034, doi:10.1080/00032717608059167.
- Mccurry, J.D. Analysis of Total Petroleum Hydrocarbons in Environmental Samples Using Ultra-Fast Gas Chromatography Application Note Author. 2018.
- EURACHEM Guide The Fitness for Purpose of Analytical Methods A Laboratory Guide to Method Validation and Related Topics; 1998; ISBN 0948926120.
- United State Environmental Protection Agency (EPA) of Science Office Method 1663: Differentiation of Diesel and Crude Oil by GC/FID.
- Summers, W.R.; Tewari, Y.B.; Schreiber, H.P. Thermodynamic Interaction in Poly(Dimethylsiloxane)-Hydrocarbon Systems From Gas-Liquid Chromatography. Rubber Chemistry and Technology 1972, 45, 1655–1664, doi:10.5254/1.3544769.
- Oña-Ruales Jorge O.; Wilson Walter B.; Nalin Federica; Sander Lane C.; Schubert-Ullrich Patricia; Wise Stephen A. The Influence of the Aromatic Character in the Gas Chromatography Elution Order: The Case of Polycyclic Aromatic Hydrocarbons. Molecular Physics 2016, 114, 3533–3545, doi:10.1080/00268976.2016.1246756.
How to cite this article
Cite this article
APA style shown. Use “Cite” for MLA, Chicago, IEEE, BibTeX and RIS formats.
Metrics
907
Article views
106
PDF downloads